EUR/USD

Higher time frames
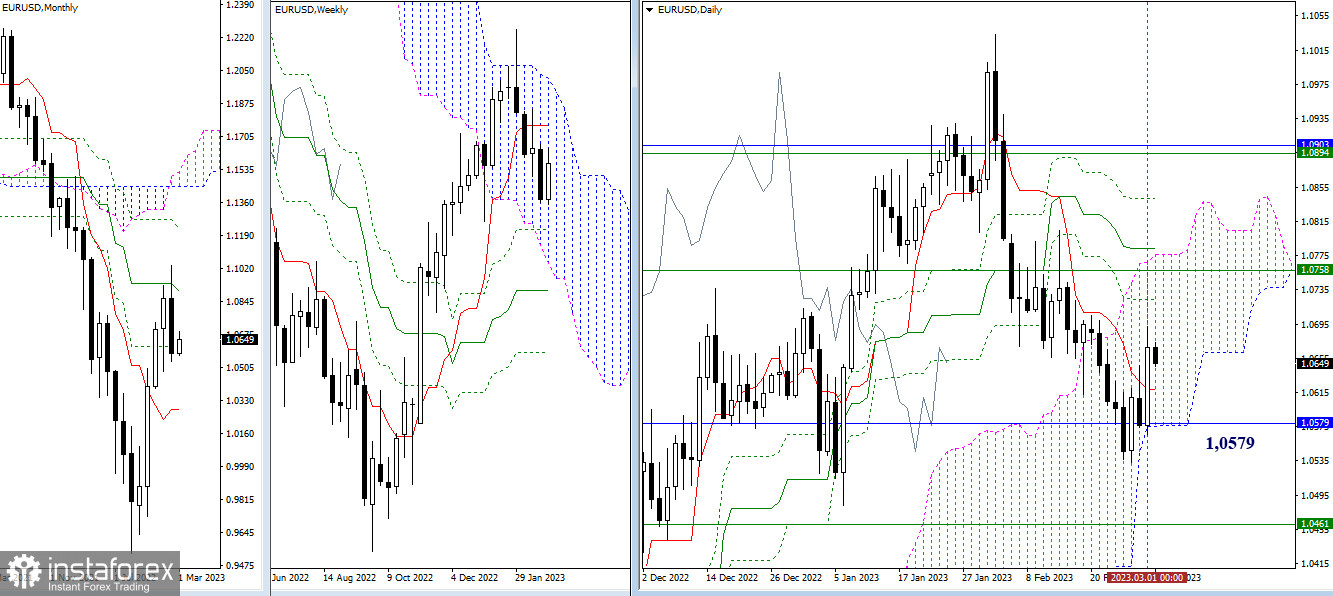
Strong support formed at 1.0579 stopped bears from pushing the pair further down. This allowed bulls to recover significantly in the past 24 hours. They took hold of the daily short-term trend levels and paved the way to the next upward targets at 1.0724 – 1.0783 – 1.0842 (the levels of the daily Ichimoku Cross) and 1.0758 – 1.0777 (weekly short-term trend + upper line of the daily Ichimoku Cloud).

H4 – H1
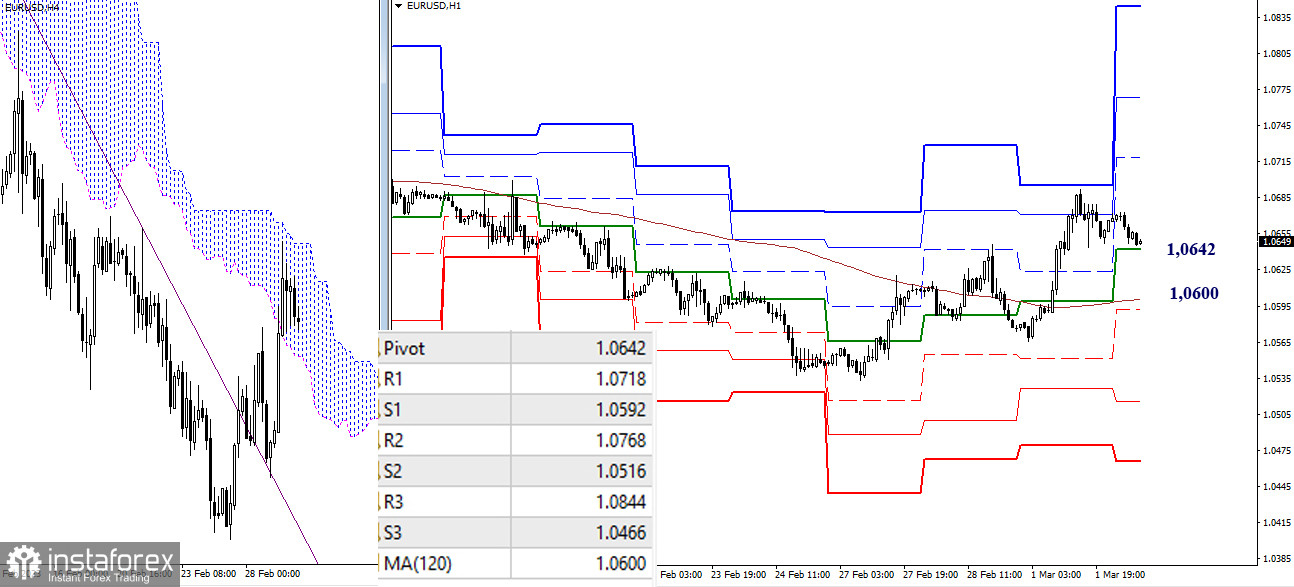
On lower time frames, bulls are in control of the market. The key levels today are found at the central pivot level of 1.0642 and the weekly long-term trend at 1.0600. If the pair develops an intraday uptrend, it may break above the resistance formed by standard pivot levels of 1.0718 – 1.0768 – 1.0844. In case bulls lose control of the key area at 1.0642-00, the market balance may change and bears will take over. If so, the main goal for the sellers will be to retest the extremum point of 1.0533. More downward targets on the intraday chart are found at the support formed by the standard pivot levels of 1.0592 – 1.0516 – 1.0466.
***
GBP/USD

Higher time frames
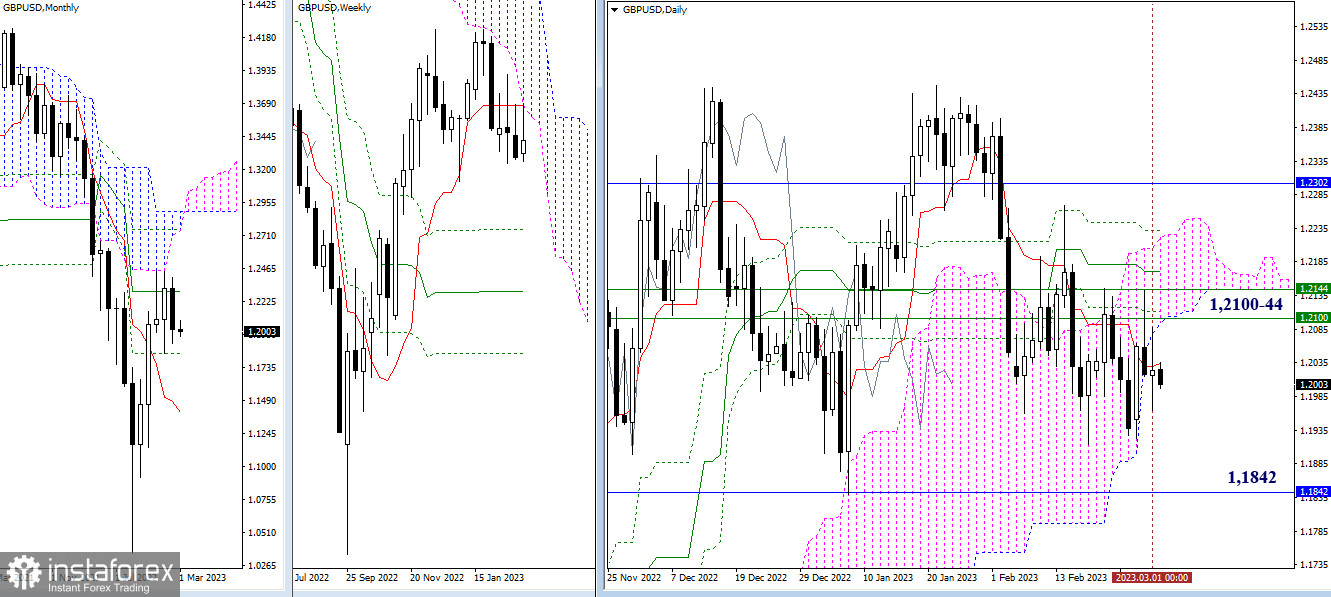
The pound/dollar pair continues to consolidate on higher time frames. The price left the sideways channel and the daily Ichimoku Cloud and entered the selling zone. Bears may take advantage of this move and assert their strength but this still remains to be seen. The key support for today is found at the level of the daily short-term trend at 1.2034. The trading range is formed by the weekly and daily resistance of 1.2100 – 1.2144 and the monthly support of 1.1842.

H4 – H1
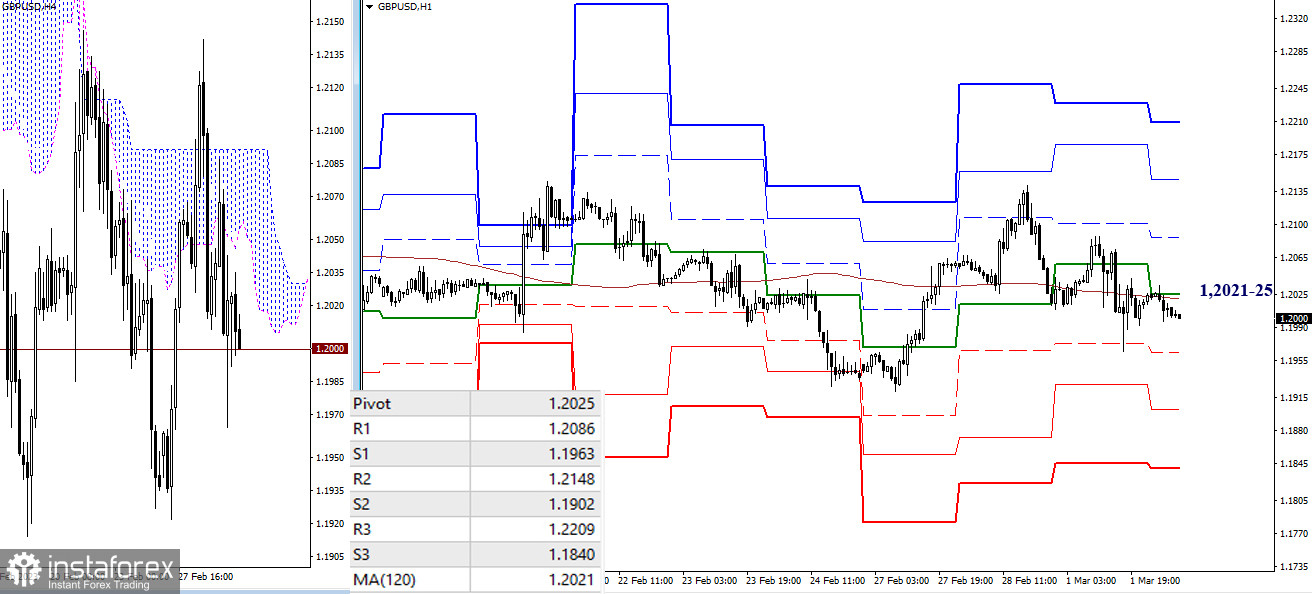
Market uncertainty is also observed on lower time frames. The pair has been trading near the key levels for quite some time. Today, they are found in the area of 1.2021-25 (central pivot level + weekly long-term trend). In case the bearish bias intensifies on the intraday chart, the downward targets will be found at the support area formed by the standard pivot levels of 1.1963 – 1.1902 – 1.1840. If bulls are back in the market, the resistance of standard pivot levels of 1.2086 – 1.2148 – 1.2209 will serve as their upward targets.
***
Technical analysis is based on:
Higher time frames – Ichimoku Kinko Hyo (9.26.52) + Fibo Kijun levels
Lower time frames – H1: Pivot Points (standard) + 120-day Moving Average (weekly long-term trend)
 English
 Русский
 Bahasa Indonesia
 Bahasa Malay
 ไทย
ไทย Español
 Deutsch
 Български
 Français
 Tiếng Việt
 中文
中文 বাংলা
বাংলা हिन्दी
 Čeština
 Українська
 Română

