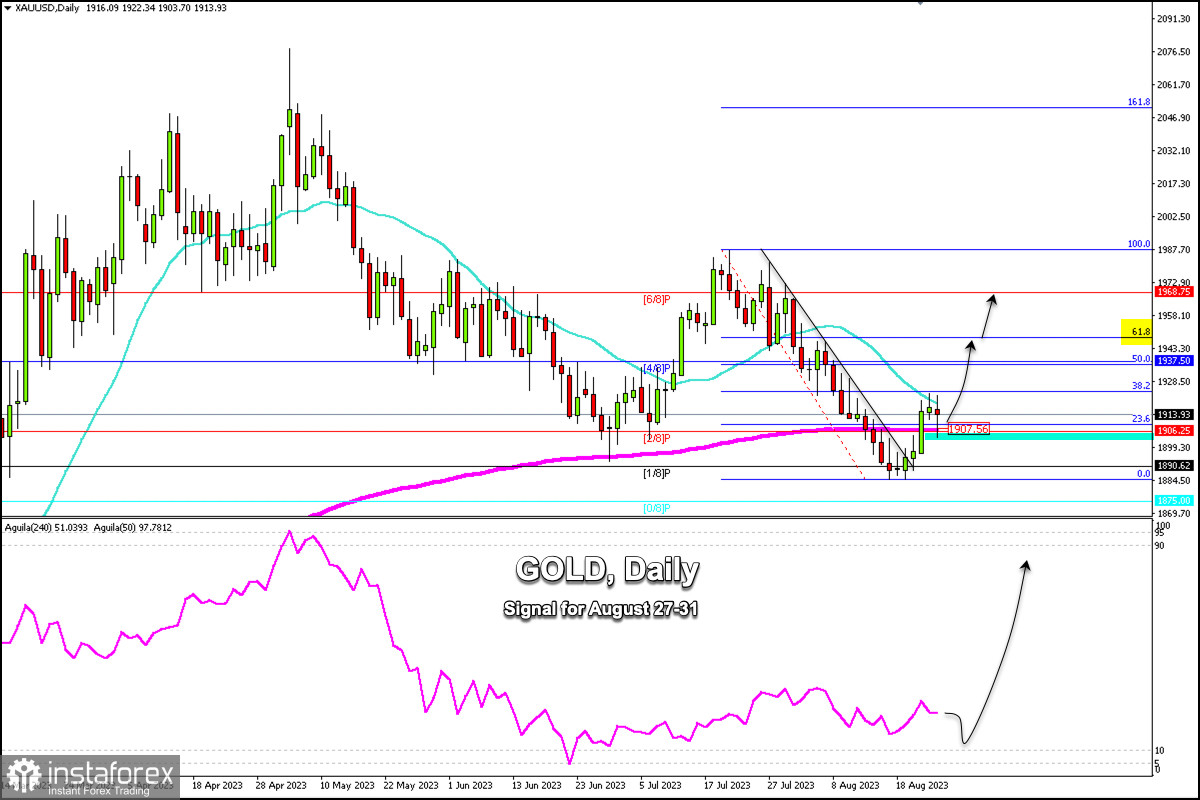
According to the daily chart, gold (XAU/USD) is now above the 200 EMA located at 1,907.56 and above the strong support of 1,906. We can see a recovery of the instrument after almost a month of downward pressure.
XAU/USD formed a double bottom around 1,984.81 and from that level made a sharp break of the downtrend channel formed since July 13. The price reached 1,923.31 on Thursday last week.
On the daily gold chart, the 61.8% Fibonacci level is located around 1,950. This level could serve as a target for bulls if gold consolidates above 2/8 Murray (1,906) in the next few days.
In case the bullish force prevails and if gold breaks above 1,950 (61.8%), we could expect it to reach 6/8 Murray at 1,968 and even the 100% Fibonacci retracement around 1,987.
On the other hand, in case XAU/USD resumes its bearish cycle in the next few days, we could expect a fall below 1,906. It will be confirmed if gold trades below the psychological level of $1,900. If this scenario occurs, it could mean an escalation of the bearish pressure in the short term and the price could reach 0/8 Murray at 1,875.
Our strategy for the next few days is to buy gold if it trades above 1,906. This will be seen as an opportunity to buy in the short term with targets at 1,921, 1,937, and 1,950.
The Eagle indicator is in a positive zone. However, the signal is still neutral. We assume a recovery in gold above 1,926 which could be seen as an opportunity to buy.
 English
 Русский
 Bahasa Indonesia
 Bahasa Malay
 ไทย
ไทย Español
 Deutsch
 Български
 Français
 Tiếng Việt
 中文
中文 বাংলা
বাংলা हिन्दी
 Čeština
 Українська
 Română

