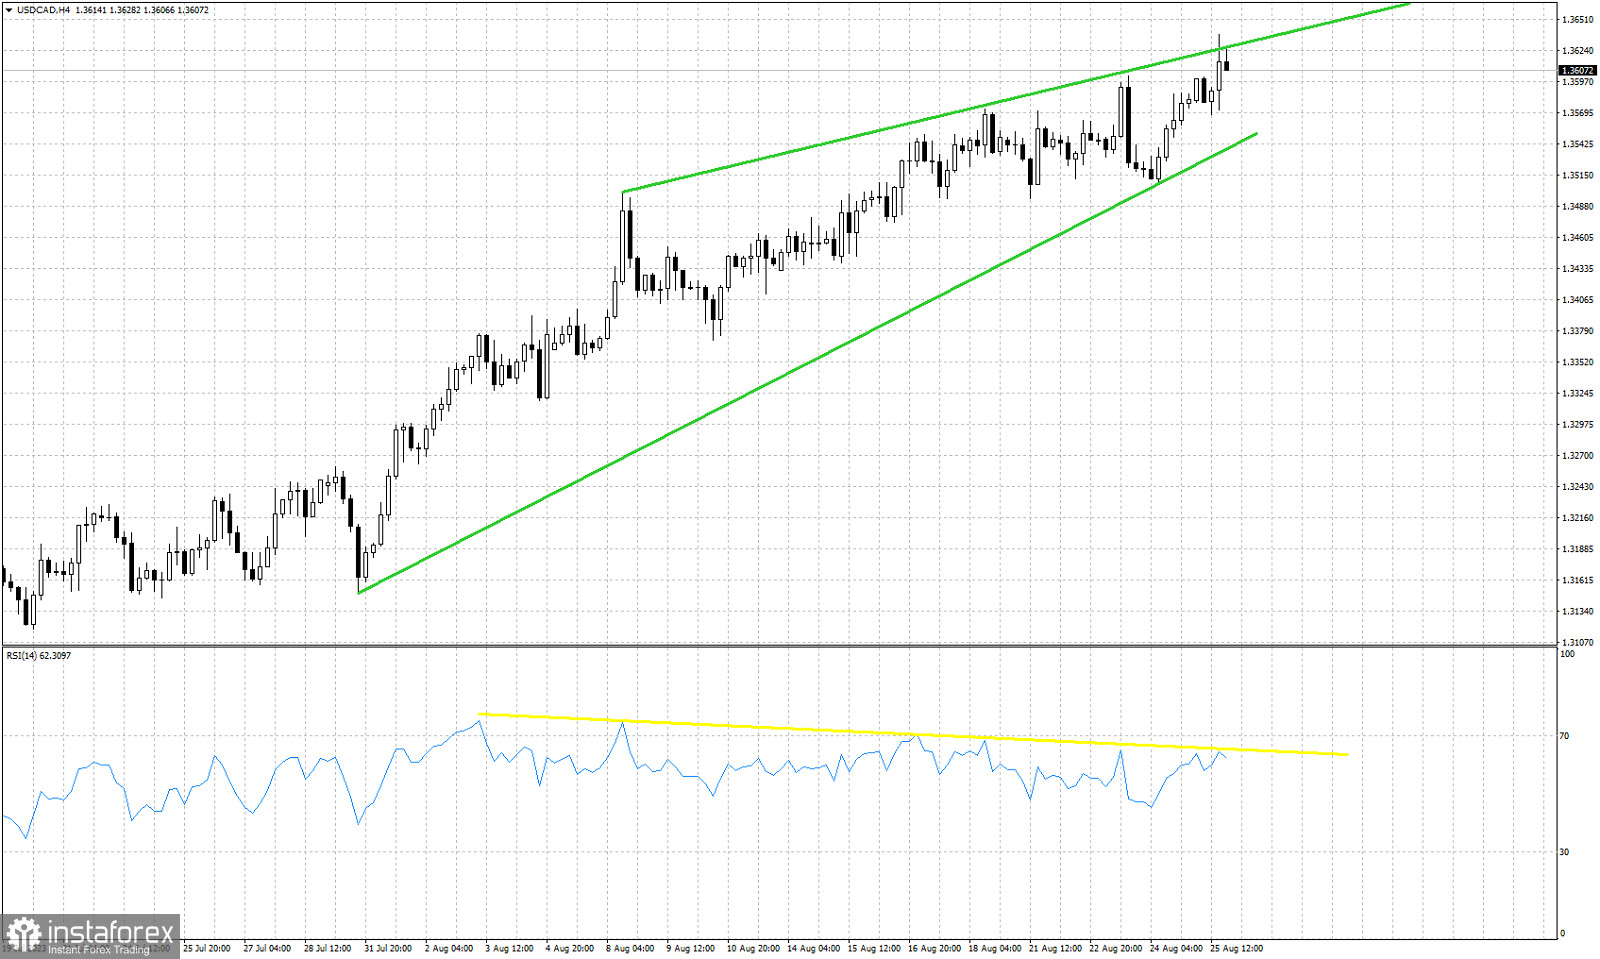
Yellow line- bearish RSI divergence
green lines- wedge pattern
USDCAD is trading around 1.3605 after making a new higher high today at 1.3638. The new higher high in price was not followed by a higher high in the RSI. On the contrary the RSI made a new lower high forming another bearish divergence. We are going to repeat our view from our last analysis on USDCAD. At current levels we believe there is limited upside potential and the chances of a reversal are high. Support is found at the lower green trend line at 1.3540. A break below this level will increase dramatically the chances of confirming a reversal in short-term trend. USDCAD justifies a pull back towards 1.3450 at least. At current levels we prefer to be neutral if not bearish.
 English
 Русский
 Bahasa Indonesia
 Bahasa Malay
 ไทย
ไทย Español
 Deutsch
 Български
 Français
 Tiếng Việt
 中文
中文 বাংলা
বাংলা हिन्दी
 Čeština
 Українська
 Română

