Deal analysis for Tuesday:
30M EUR/USD pair chart

On Tuesday, the EUR/USD currency pair displayed some odd movements. First of all, it exceeded the downward channel's limits. Second, it stopped moving upward and went back to the area below the 1.0587 level. And all of this with no macroeconomic or fundamental background at all. As a result, traders indicated that they were prepared to stop selling the pair, but there was also no significant interest in purchases. Given the excessive and sudden growth of the European currency in recent months, we continue to think that the pair should decline. The decrease in quotes may therefore resume following the current upward pullback, but at this point, the monetary policies of the ECB and the Fed are once again crucial. Also, the fundamental background is continually changing as a result of new speeches from officials from both central banks, so there can be a "swing" in the pair for a while. Technically speaking, development in the upcoming days is more probable.
5M chart of the EUR/USD currency pair

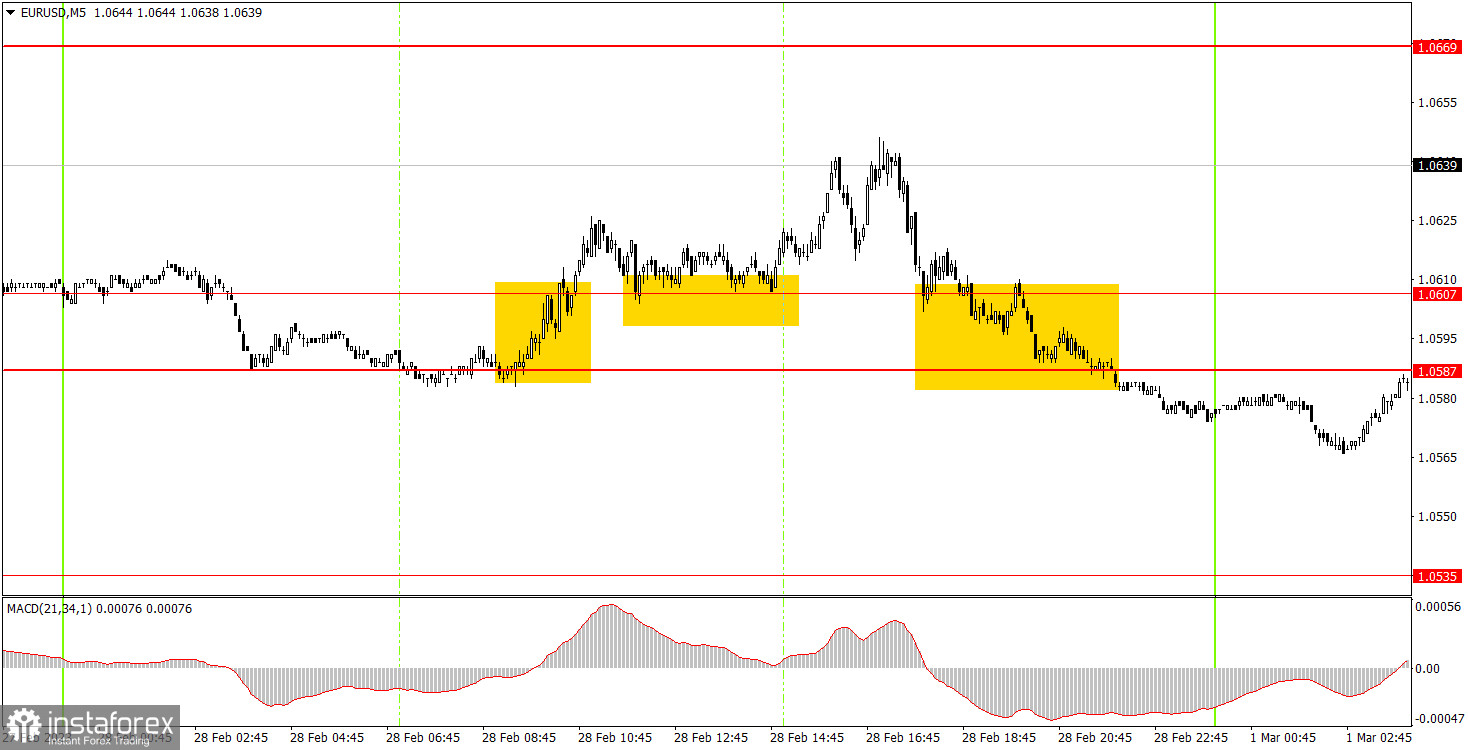
On Monday, there weren't many trading signals. The two were able to ascend and descend throughout the day. As a result, all signals developed close to the 1.0587–1.0607 range. The pair first got a foothold above it, which should have been interpreted as a buy signal, but it only managed to move 30 points in the right direction. This was sufficient to establish a stop-loss at breakeven, but traders could only profit from this deal if they manually closed the position. Later, a sell signal developed near the same price range of 1.0587-1.0607, but it did so almost at night, so new traders shouldn't use it to enter the market.
How to trade on Wednesday:
The pair left the declining channel on the 30-minute period and already today has the desire to continue rising. Growth is now more likely because the falling channel's exit represents a buy signal. Nonetheless, this week will feature several significant macroeconomic publications that can change the market's sentiment. The levels to be taken into consideration for the 5-minute TF tomorrow are 1.0391, 1.0433, 1.0465–1.0483, 1.0535, 1.0587–1.0607, 1.0669, 1.0697, and 1.0792. You can set the Stop Loss to break even if you pass 15 positive points. The release of a report on business activity in the US ISM manufacturing sector will be nearly the sole event on Wednesday. We warn beginning traders that this report is more significant than the typical business activity index (Markit), thus we anticipate that the response will be highly apparent.
General guidelines for the trading system:
1) The amount of time it takes to generate the signal is used to determine the signal strength (rebound or overcoming the level). The signal was stronger and took less time;
2) All following signals from a level should be ignored if two or more trades were opened nearby on false signals (which did not result in Take-Profit or determine the closest target level);
3. Every pair in a flat has the potential to generate numerous false signals or none at all. Yet, in any event, it is advisable to stop trading at the first indications of a flat;
4) The time between the start of the European session and the middle of the American session is when trade transactions are opened, and all of them must be manually closed;
5) Signals from the MACD indicator on a 30-minute TF can only be traded if there is strong volatility and a trend that is supported by a trend line or a trend channel;
6) Two levels should be regarded as a support or resistance area if they are too close to one another (within 5 to 15 points).
Listed on the chart:
Target levels for starting purchases or sales are the levels of price support and resistance. They may be positioned close to take-profit levels;
Red channels or trend lines represent the current trend and indicate the direction in which trading is now more profitable.
The intersection of the MACD indicator's signal line and histogram serves as a signal to buy or sell stock. It is advised to combine it with trend constructions (channels, trend lines).
Major speeches and reports that are always on the news calendar can have a big impact on how a currency pair moves. As a result, it is advised that traders trade carefully during their exit or leave the market altogether to prevent a fast price reversal from the prior action.
Novice Forex traders should keep in mind that not all transactions will be profitable. Long-term trading success is mostly dependent on developing a clear plan and practicing good money management.
 English
 Русский
 Bahasa Indonesia
 Bahasa Malay
 ไทย
ไทย Español
 Deutsch
 Български
 Français
 Tiếng Việt
 中文
中文 বাংলা
বাংলা हिन्दी
 Čeština
 Українська
 Română

