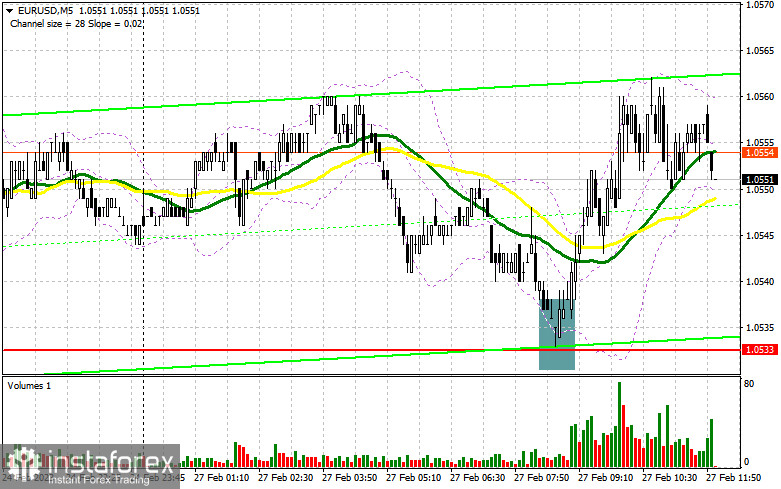
I focused on the 1.0533 level in my morning forecast and advised using it to make trading decisions. Let's take a look at the 5-minute chart and see what happened. The pair's decline to 1.0533, which occurred against the backdrop of the MACD indicator's growing divergence, which I paid particular attention to in the morning, as well as a false breakout at this level, gave us an excellent entry point to buy. Although the upward trend was roughly 30 points at the time of writing, we fell short of our target of 1.0574. The technical situation was left unchanged for the remainder of the day.

If you want to trade long positions on EUR/USD, you will need:
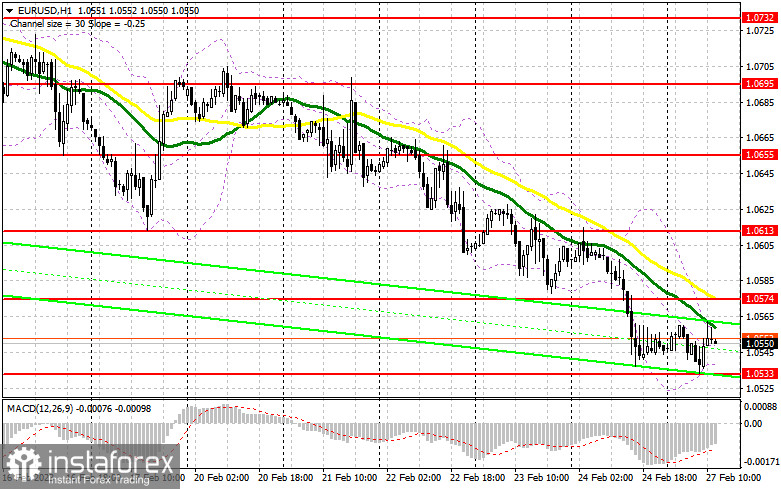
Naturally, volatility should increase in the second half of the day as several data points that could strengthen the US dollar are anticipated. Given that the divergence has nearly reached its conclusion, it is probable that pressure on the pair will resume in the afternoon following positive reports on changes in the volume of long-term goods orders, changes in the volume of pending house sales, and the speech of FOMC member Philip N. Jefferson. Consequently, bulls must maintain their defense of the 1.0533 support level, which has already been challenged today, in case the pair experiences another decline. Only the next formation of a false breakout at this level, as described above, will be a basis for establishing long positions based on the development of an upward correction and the updating of the nearest resistance of 1.0574, where the moving averages are on the bears' side. You can go to the area of 1.0613 by breaking out of this range and testing it from the top down. This will increase your chances of a larger upward movement to 1.0655. The most distant target, although unattainable, will be a new maximum of 1.0695, from which the start of a positive trend will be signaled by the exit. I'll set the profit there. The possibility of a drop in the EUR/USD rate paired with the absence of buyers at 1.0533 in the afternoon, which is more probable, will keep sellers in charge and inevitably put further pressure on the pair. The euro can only be purchased if there is a false collapse in the vicinity of the next support level at 1.0487. To achieve an upward corrective of 30-35 points within a day, I will immediately begin long positions on the EUR/USD, expecting a rebound only from the minimum of 1.0451, or even lower, around 1.0395.
If you want to trade short positions on EUR/USD, you'll need:
The euro sellers tried, but they lacked the initiative of the major players against the backdrop of low trading volume due to a lack of key statistics. Protecting the resistance level of 1.0574, which euro buyers are currently aiming for, remains the major task. The best option for sale will be a false breakout at this level following good statistics on the US real estate market, which will result in the development of a sell signal and the euro's repeated movement down to the 1.0533 area. A true struggle is unlikely to occur at this level. The breakdown and consolidation at 1.0533, as well as the reversal test from the bottom up, provide another indication to enter short positions with the demolition of buyers' stop orders, pushing the pair to 1.0487. With the possibility of updating 1.0451, where I advise fixing profits, we can only anticipate going beyond this level with very strong data on the American economy. The bulls will continue to dominate the market if the EUR/USD rises during the US session and there are no bears below 1.0574. In this situation, I suggest delaying sales until 1.0613. The formation of a false breakout there will serve as a new entry point for short positions. To achieve a 30- to 35-point downward correction, I will sell EUR/USD right away on a rebound from the high of 1.0655, or even higher, from 1.0695.

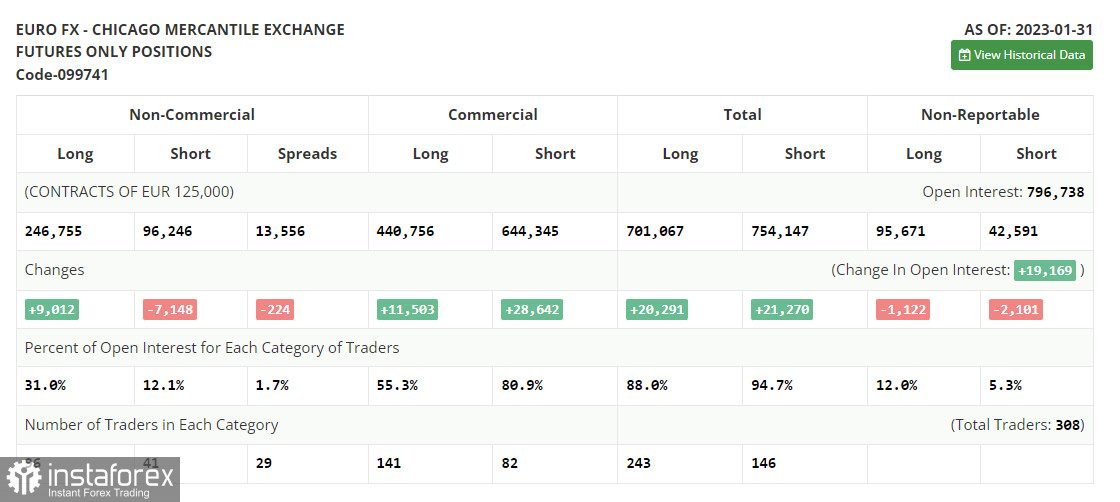
The number of long positions increased and the number of short positions decreased, according to the COT report (Commitment of Traders) for January 31. This occurred before the Federal Reserve System and the European Central Bank decided on interest rates. The information from a month ago is not very pertinent at this time, so it should be understood that these data are of little interest at this time. This is because statistics are only now starting to catch up following the cyberattack on the CFTC. I'll wait for new reports to be released before relying on more recent statistics. Except for a few reports, there are no significant fundamental indicators for the US economy this week, so the pressure on risky assets may lessen slightly. In principle, this may increase the euro's value relative to the US dollar. According to the COT data, long non-commercial positions rose by 9,012, reaching a total of 246,755, while short non-commercial positions fell by 7,149, reaching a total of 96,246. The total non-commercial net position rose to 150,509 from 134,349 after the week. The weekly closing price fell from 1.0919 to 1.0893.

Signals from indicators
Moving Averages
Trade is taking place below the 30- and 50-day moving averages, indicating the sellers' advantage.
Note that the author's consideration of the period and cost of moving averages on the hourly chart H1 differs from the standard definition of the traditional daily moving averages on the daily chart D1.
Bands by Bollinger
The indicator's upper limit, which is located at 1.0565, will serve as resistance in the event of growth.
Description of indicators
- Moving average (moving average determines the current trend by smoothing out volatility and noise). Period 50. The graph is marked in yellow.
- Moving average (moving average determines the current trend by smoothing out volatility and noise). Period 30. The graph is marked in green.
- MACD indicator (Moving Average Convergence / Divergence - moving average convergence/divergence) Fast EMA period 12. Slow EMA period 26. SMA period 9
- Bollinger Bands (Bollinger Bands). Period 20
- Non-profit speculative traders, such as individual traders, hedge funds, and large institutions use the futures market for speculative purposes and to meet certain requirements.
- Long non-commercial positions represent the total long open position of non-commercial traders.
- Short non-commercial positions represent the total short open position of non-commercial traders.
- Total non-commercial net position is the difference between the short and long positions of non-commercial traders.
 English
 Русский
 Bahasa Indonesia
 Bahasa Malay
 ไทย
ไทย Español
 Deutsch
 Български
 Français
 Tiếng Việt
 中文
中文 বাংলা
বাংলা हिन्दी
 Čeština
 Українська
 Română

