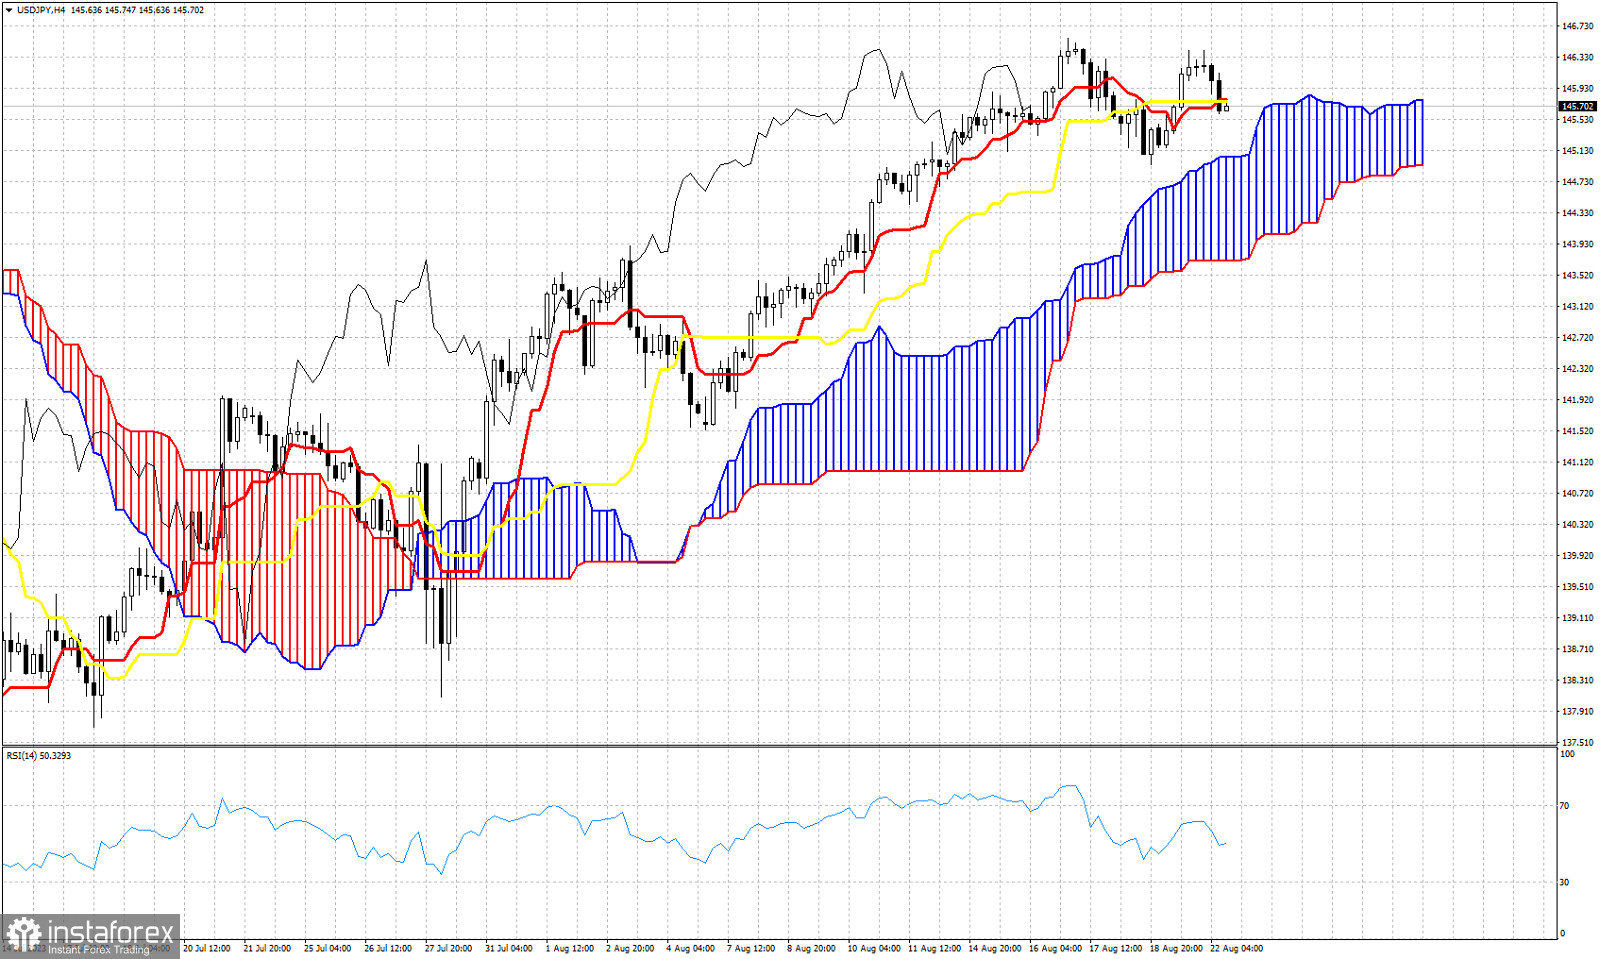
USDJPY is trading around 145.70. In the 4 hour chart trend according to the Ichimoku cloud indicator remains bullish as price is still above the cloud. However price is now challenging the tenkan-sen (red line indicator) and the kijun-sen (yellow line indicator). A close below 145.76 will be a sign of weakness. Price is vulnerable to a move towards the Kumo support at 145.05. The Chikou span (black line indicator) is very close to turning bearish, by breaking below the candlestick pattern. In the 4 hour USDJPY chart we get several warning signs that increase the chances of a short-term trend reversal. If price breaks inside the Kumo then the trend will change to neutral from bullish. Traders need to be very cautious.
 English
 Русский
 Bahasa Indonesia
 Bahasa Malay
 ไทย
ไทย Español
 Deutsch
 Български
 Français
 Tiếng Việt
 中文
中文 বাংলা
বাংলা हिन्दी
 Čeština
 Українська
 Română

