Details of the economic calendar on February 21
Particular attention was given to the preliminary assessment of business activity indices in Europe, Great Britain and the United States.
Details of PMI statistics:
The Eurozone manufacturing PMI fell from 48.8 to 48.5 in February, with a forecast of 49.5. Services PMI for the same period rose from 50.8 to 53.0, with a forecast of 51.5. And the composite PMI rose from 50.3 to 52.3, with a forecast of 51.0.
The euro did not win back the news flow in any way.
UK manufacturing PMI rose from 47.0 to 49.2, with a forecast of 47.5. Services PMI rose from 48.7 to 53.3, while composite PMI rose from 48.5 to 53.0.
The pound sterling reacted to the statistical data with a rise in value.
U.S. Manufacturing PMI rose from 46.9 to 47.8. Services PMI rose from 46.8 to 50.5 points, while composite PMI rose from 46.8 to 50.2 points.
The dollar reacted not quite typically to positive statistics.

Analysis of trading charts from February 21
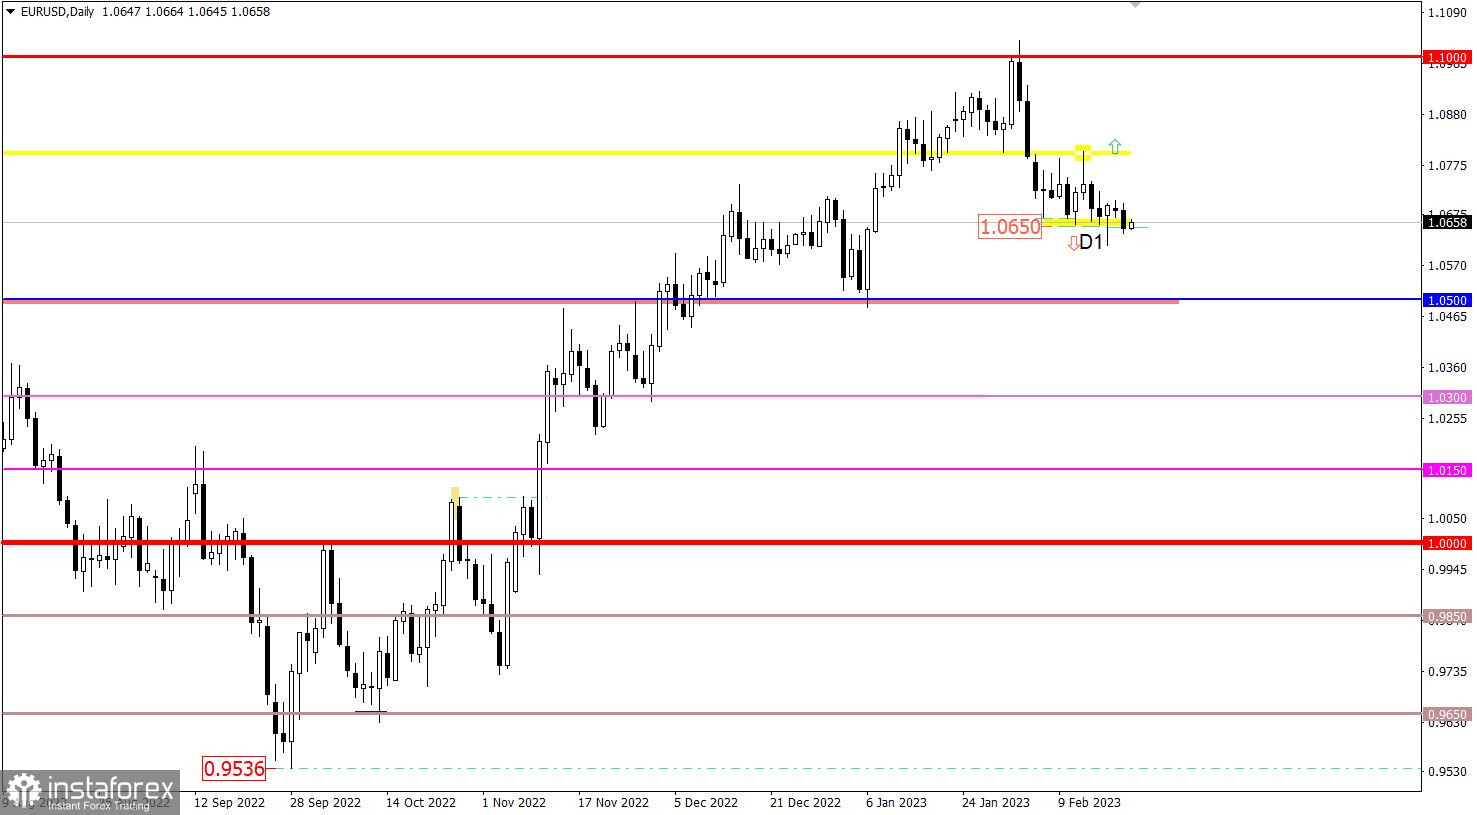
Despite the local manifestation of speculative activity, the EURUSD currency pair continues to move within the level of 1.0650. This indicates a typical uncertainty of the direction of movement among market participants.
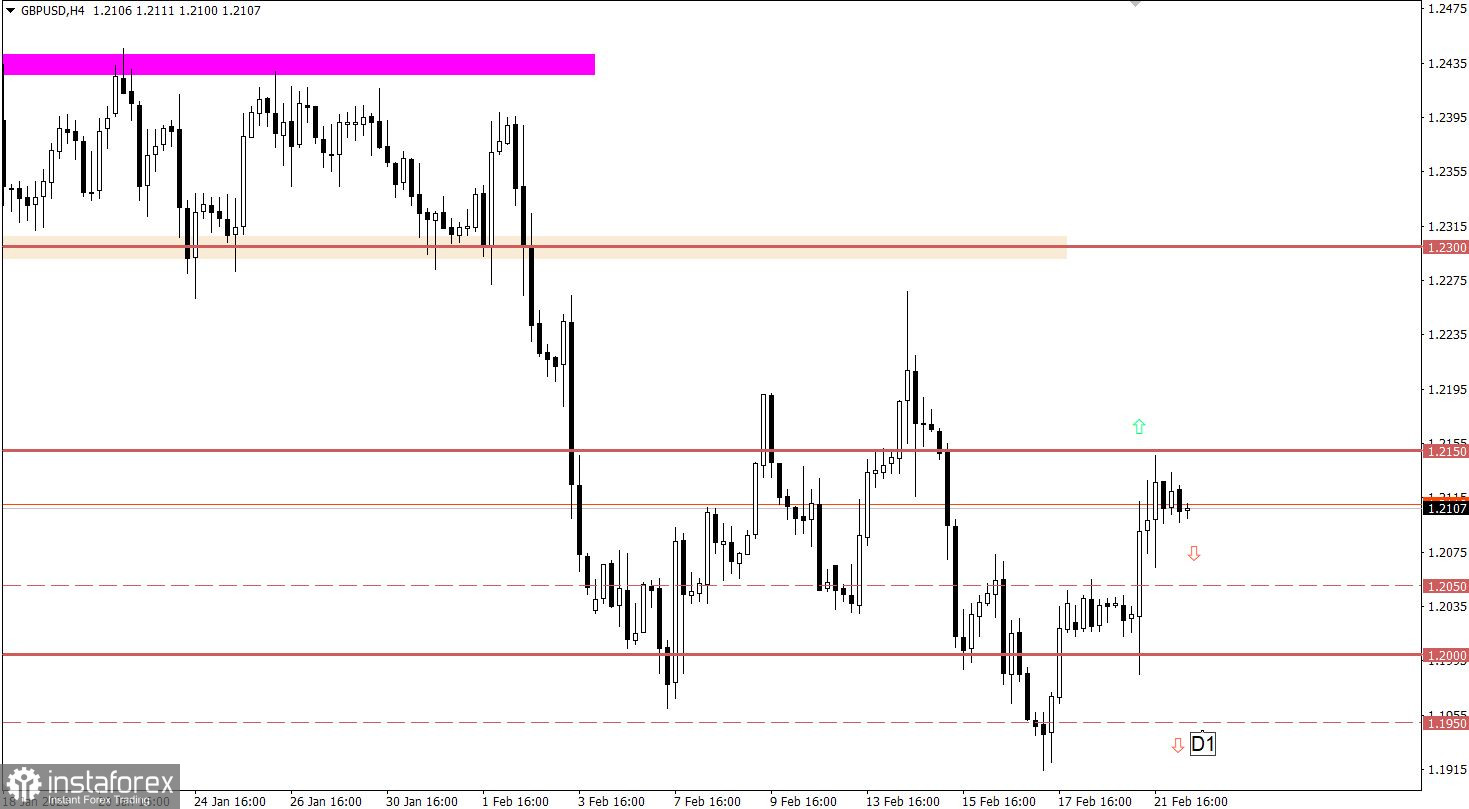
The GBPUSD currency pair was able to overcome the stagnation in the upper area of the 1.2000/1.2050 psychological level due to the upward momentum. This led to an increase in the volume of long positions on the pound sterling and a further rise of quotes to 1.2150.
Economic calendar for February 22
Today, the macroeconomic calendar is almost empty except for a few publications which are unlikely to attract the attention of large investors. However, familiarization with the FOMC protocol, which will be released at 19:00 UTC, may be informative.
EUR/USD trading plan for February 22
In order for the market to have a technical signal about the continuation of the current corrective trend, the quote needs to stay below the level of 1.0650 in the daily period. In such a situation, an increase in the volume of short positions on the euro is possible, which will lead to a decrease in the price to the level of 1.0500.
If the market moves in an alternative direction, the quote needs to rise above the level of 1.0750 to continue the upward trend. In this case, an increase to the level of 1.0800 is possible.

GBP/USD trading plan for February 22
Buyers face resistance at 1.2150, which leads to a decrease in the volume of long positions and stagnation-pullback in the market. In order to continue rising, the quote needs to be kept above the level of 1.2150 within a 4-hour period. If this level is not overcome, the quote may return to the 1.2000 support level.

What's on the charts
The candlestick chart type is white and black graphic rectangles with lines above and below. With a detailed analysis of each individual candle, you can see its characteristics relative to a particular time frame: opening price, closing price, intraday high and low.
Horizontal levels are price coordinates, relative to which a price may stop or reverse its trajectory. In the market, these levels are called support and resistance.
Circles and rectangles are highlighted examples where the price reversed in history. This color highlighting indicates horizontal lines that may put pressure on the asset's price in the future.
The up/down arrows are landmarks of the possible price direction in the future.
 English
 Русский
 Bahasa Indonesia
 Bahasa Malay
 ไทย
ไทย Español
 Deutsch
 Български
 Français
 Tiếng Việt
 中文
中文 বাংলা
বাংলা हिन्दी
 Čeština
 Українська
 Română

