GBP/USD on M5

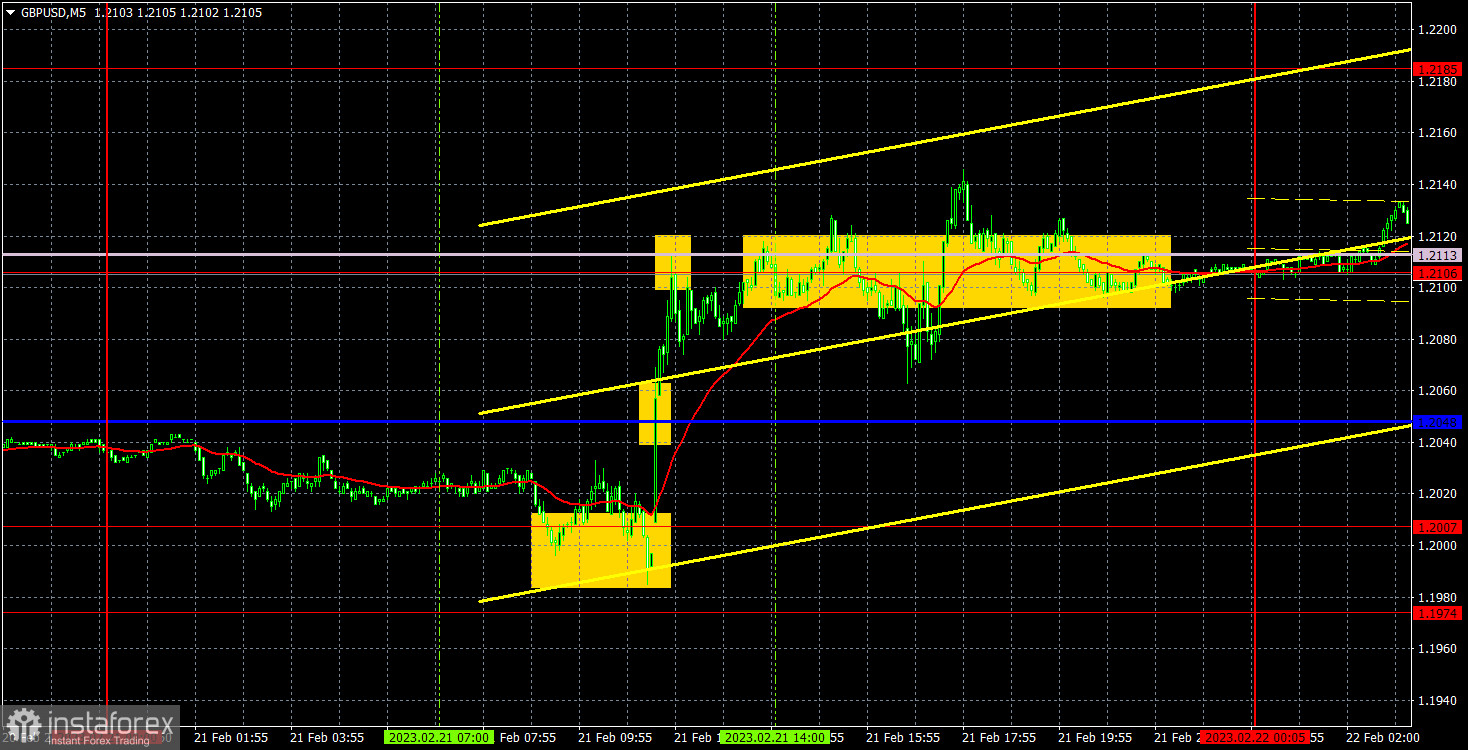
On Tuesday, GBP/USD was trading in positive territory. In yesterday's review about the euro/dollar pair, I mentioned the publication of business activity data in the eurozone, Germany, the UK, and the US. So, traders had enough drivers to follow. On the other hand, these reports are not that important. Still, stronger-than-expected data from the UK set the market in motion. Recently, investors have been especially concerned about the state of the UK economy. At first, economists feared a recession that could last for two years. Now, they expect it to last for just 5 quarters. The situation is improving slightly although it is still far from a full recovery. Therefore, the pound sterling advanced yesterday on the news that all three indicators showed growth. In the North American session, similar data also caused a reaction in the market although it was less pronounced. In other words, the US dollar depreciated even though all three indicators posted a significant increase.
Trading signals were rather mixed yesterday. A rebound from the area of 1.1974-1.2007 was hard to catch as this is when the UK data was released. So, nobody could have predicted a strong rise in the pound. All in all, there were three signals that traders could have followed: a breakout of the critical line, a rebound from the Senkou Span B line, and a rebound from the area of 1.2106-1.2113. These weren't the best signals but they could have brought us a couple of pips in profit which is better than nothing.
COT report

GBP/USD on H1

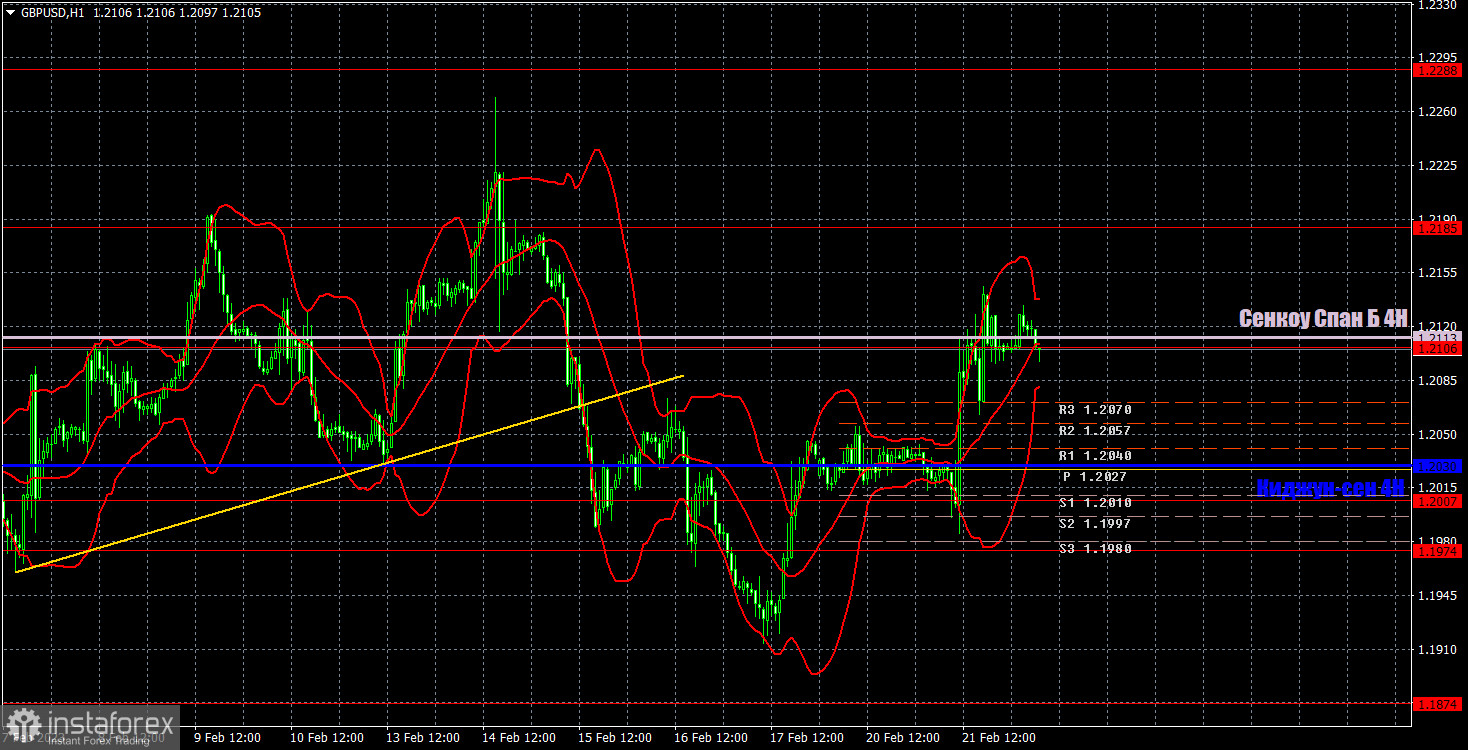
On the H1 chart, the pound/dollar pair went through a new cycle of growth and tested the key area of the Senkou Span B line. So, the downtrend remains in place although it does not look so convincing. I expect the pound to continue its fall but in a slow and ragged manner. On February 22, it is recommended to trade at the key level of 1.1760, 1.1874, 1.1974-1.2007, 1.2106, 1.2185, 1.2288, 1.2342, and 1.2429. The Kijun-sen (1.2030) and Senkou Span B (1.2113) lines can also generate signals. Rebounds and breakouts from these lines can also serve as trading signals. It is better to set the Stop Loss at breakeven as soon as the price moves by 20 pips in the right direction. The lines of the Ichimoku indicator can change their position throughout the day which is worth keeping in mind when looking for trading signals. On the chart, you can also see support and resistance levels where you can take profit. On Wednesday, neither the UK nor the US has any important economic publications. The only thing traders will pay attention to is the FOMC minutes later in the day. The results of the FOMC meeting may show the increased hawkish sentiment among the monetary committee members. So, it is better to keep a close eye on it.
On the chart:
Support and resistance levels are represented by bold red lines. This is where the price may stop moving. They do not generate trading signals.
The Kijun-sen and Senkou Span B lines are the lines of the Ichimoku indicator transferred to the 1-hour time frame from the 4-hour time frame. They are considered strong levels.
Extremum levels are thin red lines from where the price rebounded earlier. They generate trading signals.
Yellow lines are trendlines, trend channels, or any other technical patterns.
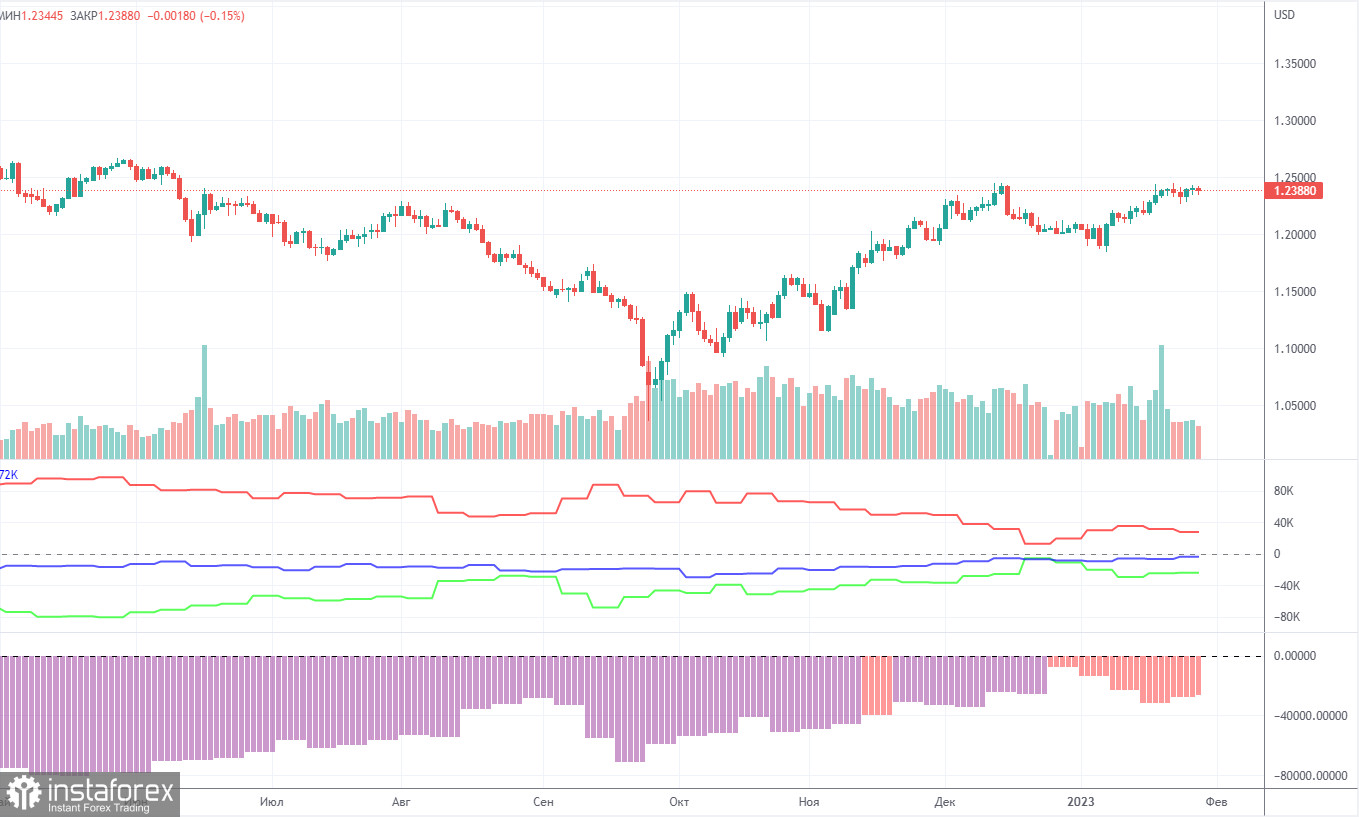
Indicator 1 on the COT chart represents the net position value of each category of traders.
Indicator 2 on the COT chart represents the net position value for the non-commercial group of traders.
 English
 Русский
 Bahasa Indonesia
 Bahasa Malay
 ไทย
ไทย Español
 Deutsch
 Български
 Français
 Tiếng Việt
 中文
中文 বাংলা
বাংলা हिन्दी
 Čeština
 Українська
 Română

