EUR/USD

Larger timeframes
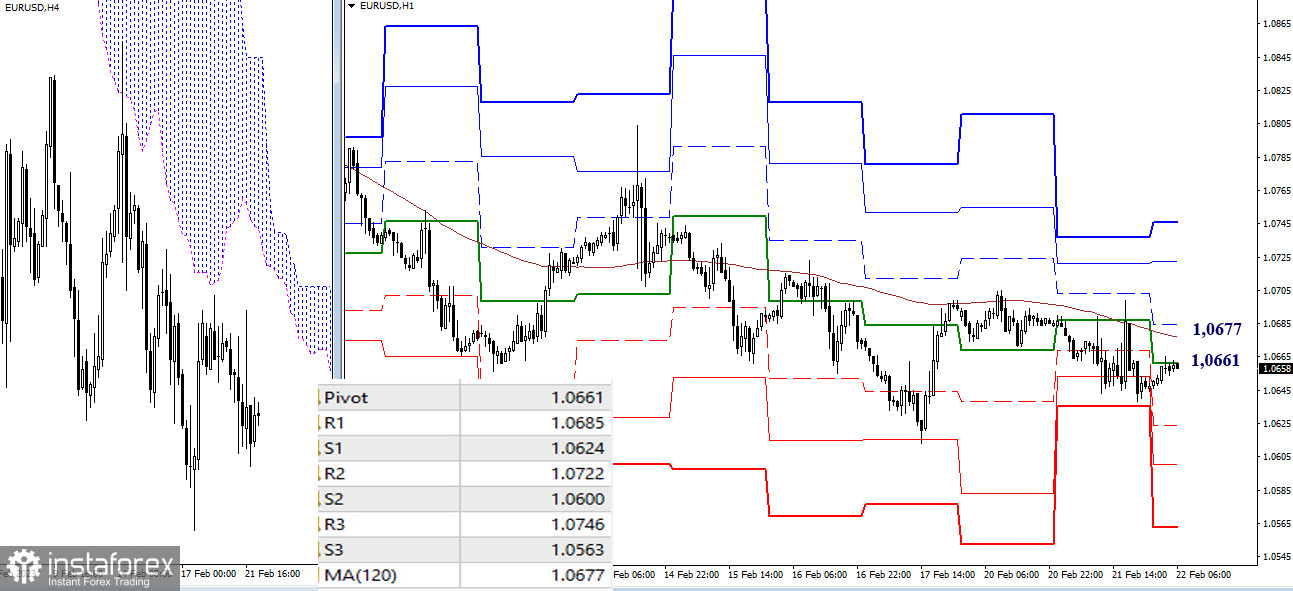
Yesterday, the euro bears were mainly holding the upper hand, but they could not update the low of the last week at 1.0613. Therefore, the previous targets are still valid. The bulls are still focused on the short-term intraday trend line of 1.0709 and the one-week trend line at 1.0758. On the other hand, the bears still aim to settle the price firmly below the one-month support at 1.0611. Once it is surpassed, it will allow traders to recognize new targets.

H4 – H1
On smaller time frames, EUR/USD remains in the bear zone. It is trading below 1.0661 – 1.0677 represented by the central pivot level + a one-week long-term trend line. The instrument could continue its decline after the price passes support of classical pivot levels which are today seen at 1.0624 – 1.0600 – 1.0563. The current balance between the bulls and bears on smaller time frames could be changed only after the price overcomes the key levels. After that, traders will shift intraday focus on the resistance of classic pivot levels such as 1.0685 – 1.0722 – 1.0746.
***
GBP/USD

Larger timeframes
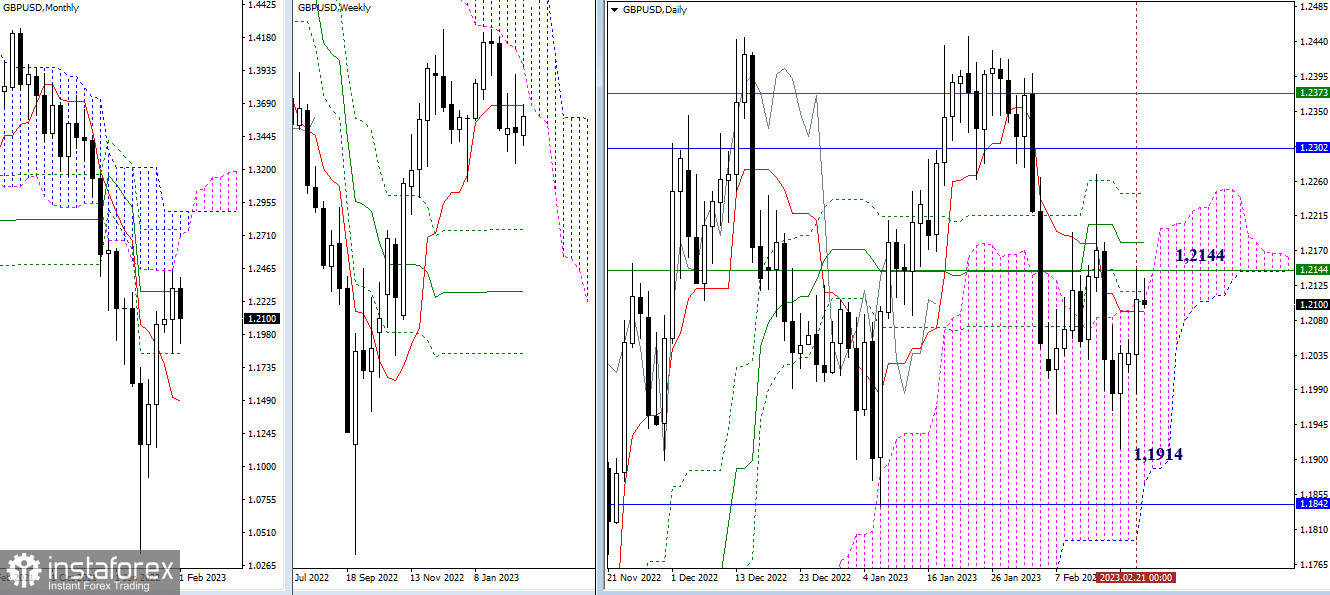
Yesterday the bulls took the lead in GBP/USD. They tested the resistance of the weekly short-term trend line of 1.2144 but they failed to surpass it. The nearest resistance levels under current market conditions are seen at 1.2180 – 1.2243 – 1.2302 – 1.2373. The support area for the time being embraces the following levels: 1.2118 – 1.2106 – 1.2092. The bears aim for the nearest significant target at the low of 1.1914.

H4 – H1
Currently, the bulls are taking advantage on smaller timeframes. Yesterday, the bears managed to settle above the key levels. The upward targets for a further intraday rise are the classic pivot levels located at 1.2174 – 1.2240 – 1.2335. The key levels now serve as support, protecting the bullish interests at 1.2979 which is a central pivot level and 1.2033 which is the weekly long-term trend line. After the instrument settles below, the balance of trading forces will change. If it comes true, the bearish targets will come into play such as support of classic pivot levels. The classic pivot levels forming support today are defined at 1.2013 – 1.1918 – 1.1852.
***
This technical analysis is based on the following ideas:
Larger timeframes - Ichimoku Kinko Hyo (9.26.52) + Fibo Kijun levels
Smaller timeframes - H1 – classic pivot points + 120-period Moving Average (weekly long-term trend line)
 English
 Русский
 Bahasa Indonesia
 Bahasa Malay
 ไทย
ไทย Español
 Deutsch
 Български
 Français
 Tiếng Việt
 中文
中文 বাংলা
বাংলা हिन्दी
 Čeština
 Українська
 Română

