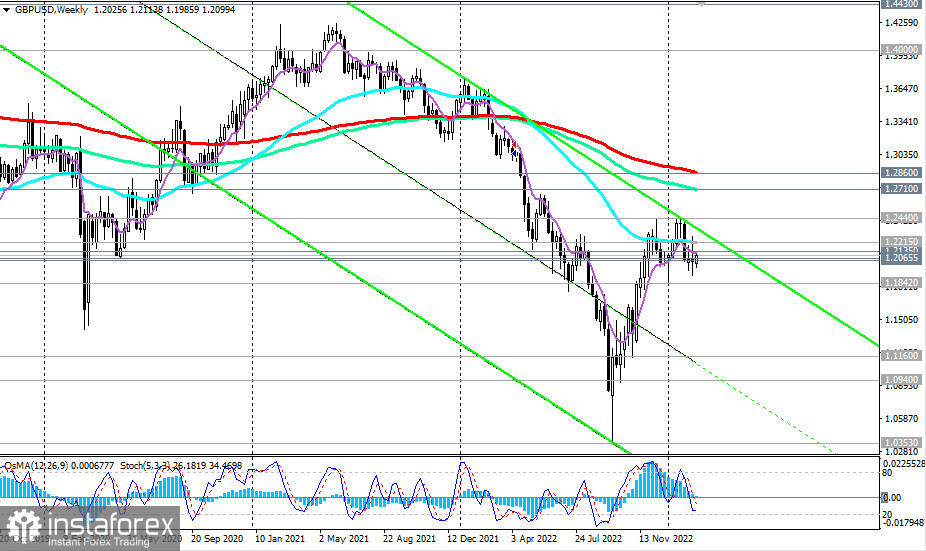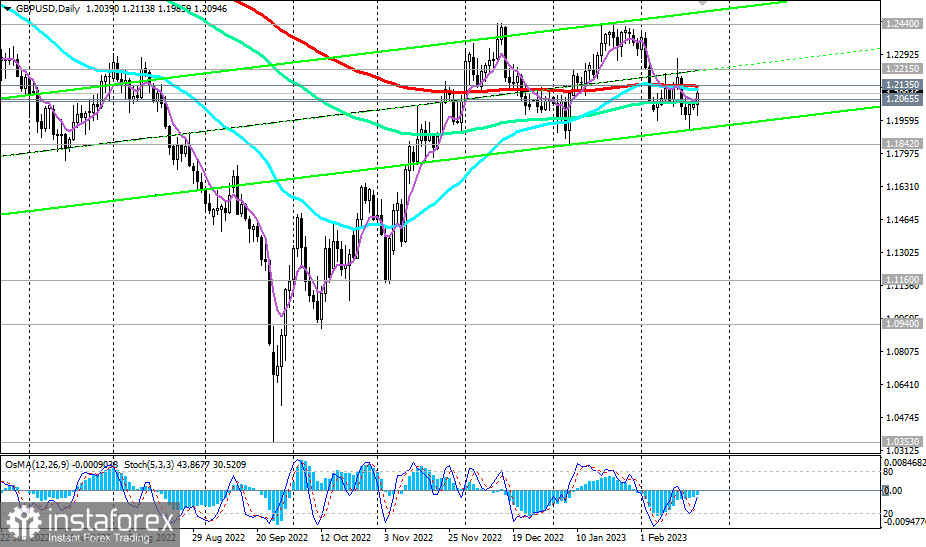
Last month, against the backdrop of the weakness of the U.S. dollar, the GBP/USD pair managed to correct from the local low of 1.1842 and reach 1.2440. Since the beginning of this month, the GBP/USD resumed to decline. The price broke through the important medium-term support levels 1.2135 (200 EMA on the daily chart), 1.2055 (144 EMA on the daily chart) and reached the local intra-month low 1.1915 last Friday.
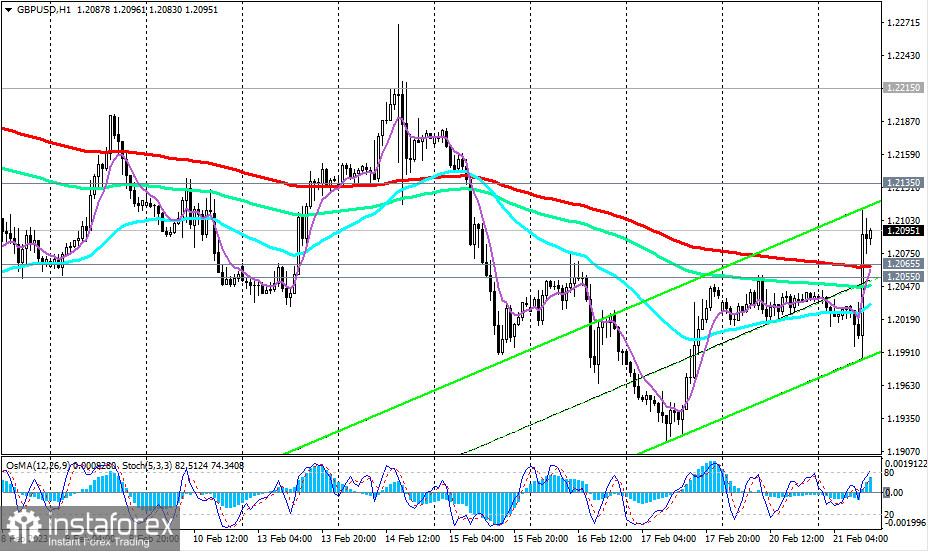
At the same time, the pound strengthened sharply today after the publication of the S&P Global report, including in the GBP/USD pair, which jumped 115 points.

The price broke the important short-term resistance level 1.2065 (200 EMA on the 1-hour chart), and the resulting bullish momentum may push the pair to the 1.2135 resistance level. Above it is unlikely, at least for now. For that the pound needs a new strong positive drivers, which are absent so far, while economists predict an imminent recession in Britain.
A rebound from the current levels and near the 1.2135 resistance level and a resumption of decline are most likely. The breakdown of the support levels 1.2065, 1.2055 will confirm the scenario for the resumption of the global downward trend of GBP/USD.

In an alternative scenario, in case of further growth and after the breakdown of the important resistance level 1.2135, GBP/USD will head towards the 1.2215 resistance level (50 EMA on the weekly chart) and then towards the key resistance levels 1.2710 (144 EMA on the weekly chart), 1.2860 (200 EMA on the weekly chart).
Support levels: 1.2065, 1.2055, 1.2000, 1.1842, 1.1160, 1.0940
Resistance levels: 1.2135, 1.2200, 1.2215, 1.2300, 1.2400, 1.2440, 1.2500, 1.2600, 1.2710, 1.2800, 1.2860
Trading scenarios
Sell Stop 1.2085. Stop-Loss 1.2145. Take-Profit 1.2065, 1.2055, 1.2000, 1.1842, 1.1160, 1.0940
Buy Stop 1.2145. Stop-Loss 1.2085. Take-Profit 1.2200, 1.2215, 1.2300, 1.2400, 1.2440, 1.2500, 1.2600, 1.2710, 1.2800, 1.2860
 English
 Русский
 Bahasa Indonesia
 Bahasa Malay
 ไทย
ไทย Español
 Deutsch
 Български
 Français
 Tiếng Việt
 中文
中文 বাংলা
বাংলা हिन्दी
 Čeština
 Українська
 Română

