 English
  Русский
 Bahasa Indonesia
 Bahasa Malay
 ไทย
ไทย Español
 Deutsch
 Български
 Français
 Tiếng Việt
 中文
中文 বাংলা
বাংলা हिन्दी
 Čeština
 Українська
 Română

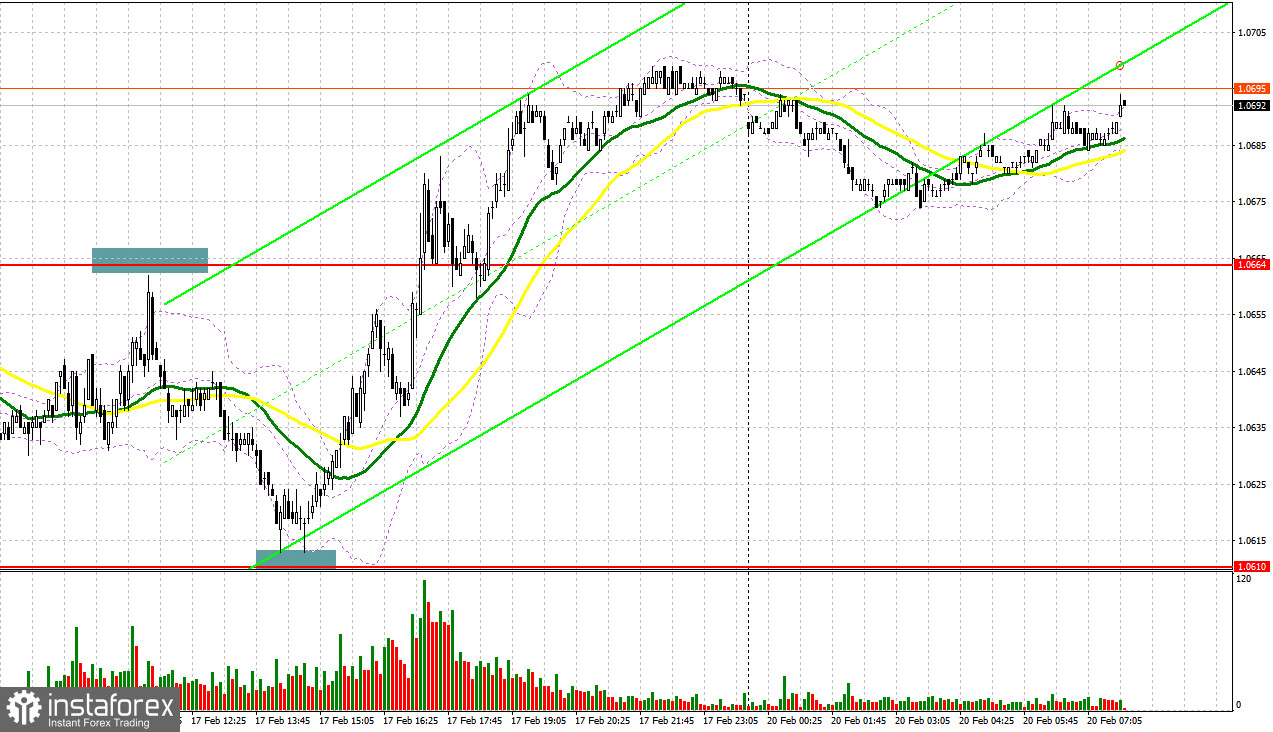
Last Friday, the pair did not form any good signals to enter the market. Let's have a look at what happened on the 5-minute chart. In my morning review, I mentioned the level of 1.0664 as a possible entry point. The price reached the level of 1.0664 but missed just a few pips to form a false breakout there. Given that the euro fell sharply afterwards, I gave up the idea of selling as there was no place to set a stop-loss order. In the second half of the day, a similar situation happened around the level of 1.0610. The pair also failed to reach it so we couldn't get an entry point into long positions.
For long positions on EUR/USD:
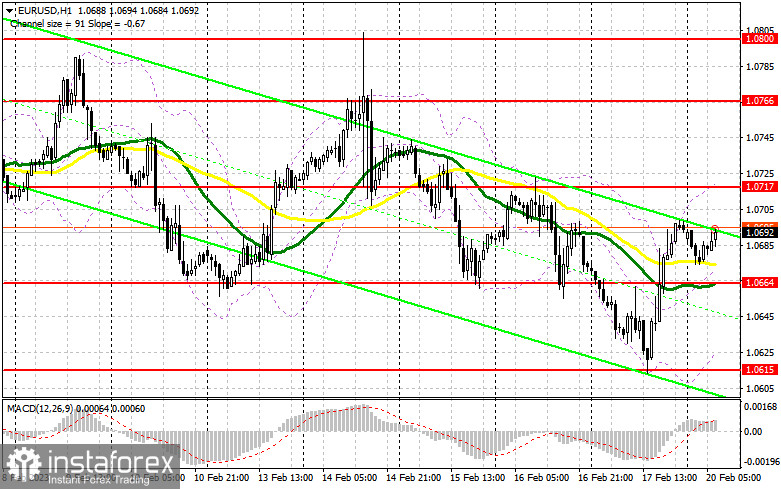
As expected, the euro went through a correction on Friday after retesting a monthly low. Yet, bears still prevail in the market and bulls have little to hope for. Given that today we have no important economic news, the correction is set to continue. The monthly report by Germany's Bundesbank will be of little importance to traders. However, the eurozone consumer confidence index may support the euro if its reading recovers back to positive zone. In case the market reaction is negative, I would recommend waiting until the price hits the nearest support of 1.0664 where moving averages support the bulls. I will buy the euro only if it forms a false breakout at this range and moves further up to the resistance of 1.0717. Yet, this level may be hard to break through. A breakout of 1.0717 and its downward retest will give us an additional entry point into long positions on the condition that the eurozone data is strong. If so, the price may even surge to 1.0766 but unlikely to cross it. In case a breakout of 1.0766 does happen, this will trigger stop-loss orders set by the bears. This will change the market balance and create a new buy signal that may take the price to 1.0800. I will be taking profit at this point. If EUR/USD declines and bulls are idle at 1.0664 in the first half of the day, the pair will stay under pressure. A breakout of 1.0664 will intensify the bearish trend. In this case, you should focus on the next support at 1.0615. Only a false breakout at this level, similar to the one that happened on Friday, will generate a buy signal. I will go long right after a rebound from the low of 1.0565 or 1.0525, keeping in mind an upward correction of 30-35 pips within the day.
For short positions on EUR/USD
Selling the pair will be possible from the level of 1.0717 but only if bears clearly assert their strength in the first half of the day. The pessimistic report on consumer confidence in the eurozone may remind traders that further monetary tightening continues to weigh on the economy. A false breakout at 1.0717 will confirm that large market players betting on the pair's decline have entered the market. If so, I will expect the price to rush to the downside to 1.0664. A breakout of this level and its retest will create an additional sell signal with the target at 1.0615, thus intensifying the bearish bias. A firm hold below this range will send the pair lower to 1.0565 where I'm going to take profit. If EUR/USD rises in the European session and bears are idle at 1.0717, bulls will return to the market. If so, open short positions only when the price reaches 1.0766 and sell there only in case of a failed attempt to settle. I will go short right after a rebound from the high of 1.0800, bearing in mind a downward correction of 30-35 pips.
COT report:
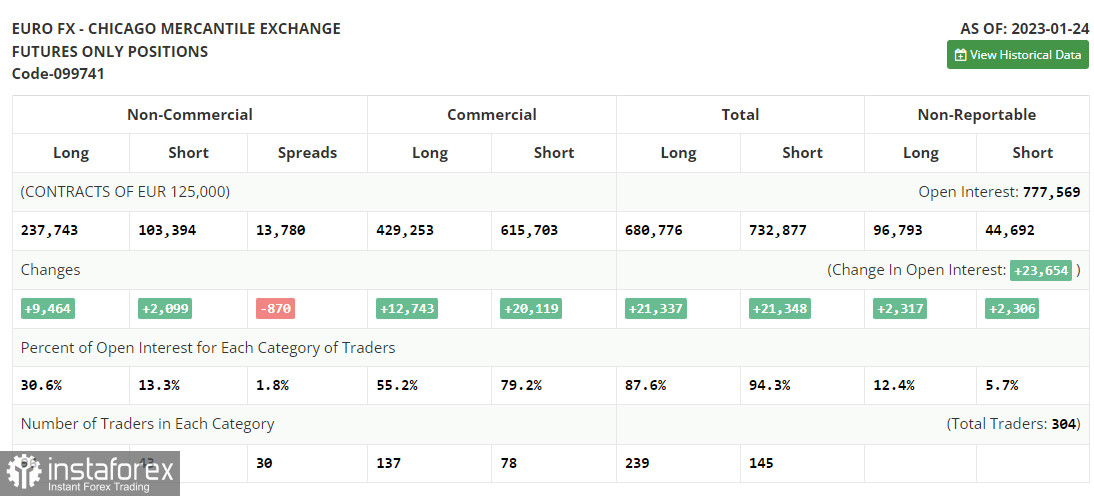
Due to a technical failure of the CFTC that has been going on for more than two weeks, new COT reports continue to be delayed. The most recent data was published on January 24.
The Commitments of Traders report for January 24 shows a rise in both short and long positions. Apparently, traders were encouraged by the ECB's hawkish statement last week and continued to add more long positions on the pair. They now expect the ECB to maintain its aggressive approach, while the Fed is expected to ease its monetary tightening. The US regulator may reduce the pace of a rate hike for the second time in a row. The recent downbeat data on the US economy, in particular, a drop in retail sales and the easing of inflationary pressure may be a signal for the US central bank to loosen its grip on the economy to avoid any damage. According to the COT report, long positions of the non-commercial group of traders increased by 9,464 to 237,743 while short positions went up by 2,099 to 103,394. At the end of the week, the total non-commercial net position rose to 134,349 from 126,984. This means that investors still believe in the upside potential of the euro but are looking for more clues from central banks regarding interest rates. The weekly closing price advanced to 1.0919 from 1.0833.
Indicator signals:
Moving Averages
Trading above the 30- and 50-day moving averages indicates that bulls are trying to regain the market.
Please note that the time period and levels of the moving averages are analyzed only for the H1 chart, which differs from the general definition of the classic daily moving averages on the D1 chart.
Bollinger Bands
If the pair advances, the upper band of the indicator at 1.0717 will serve as resistance. In case of a decline, the lower band of the indicator at 1.0664 will act as support.
Description of indicators:
• A moving average of a 50-day period determines the current trend by smoothing volatility and noise; marked in yellow on the chart;
• A moving average of a 30-day period determines the current trend by smoothing volatility and noise; marked in green on the chart;
• MACD Indicator (Moving Average Convergence/Divergence) Fast EMA with a 12-day period; Slow EMA with a 26-day period. SMA with a 9-day period;
• Bollinger Bands: 20-day period;
• Non-commercial traders are speculators such as individual traders, hedge funds, and large institutions who use the futures market for speculative purposes and meet certain requirements;
• Long non-commercial positions represent the total number of long positions opened by non-commercial traders;
• Short non-commercial positions represent the total number of short positions opened by non-commercial traders;
• The non-commercial net position is the difference between short and long positions of non-commercial traders.