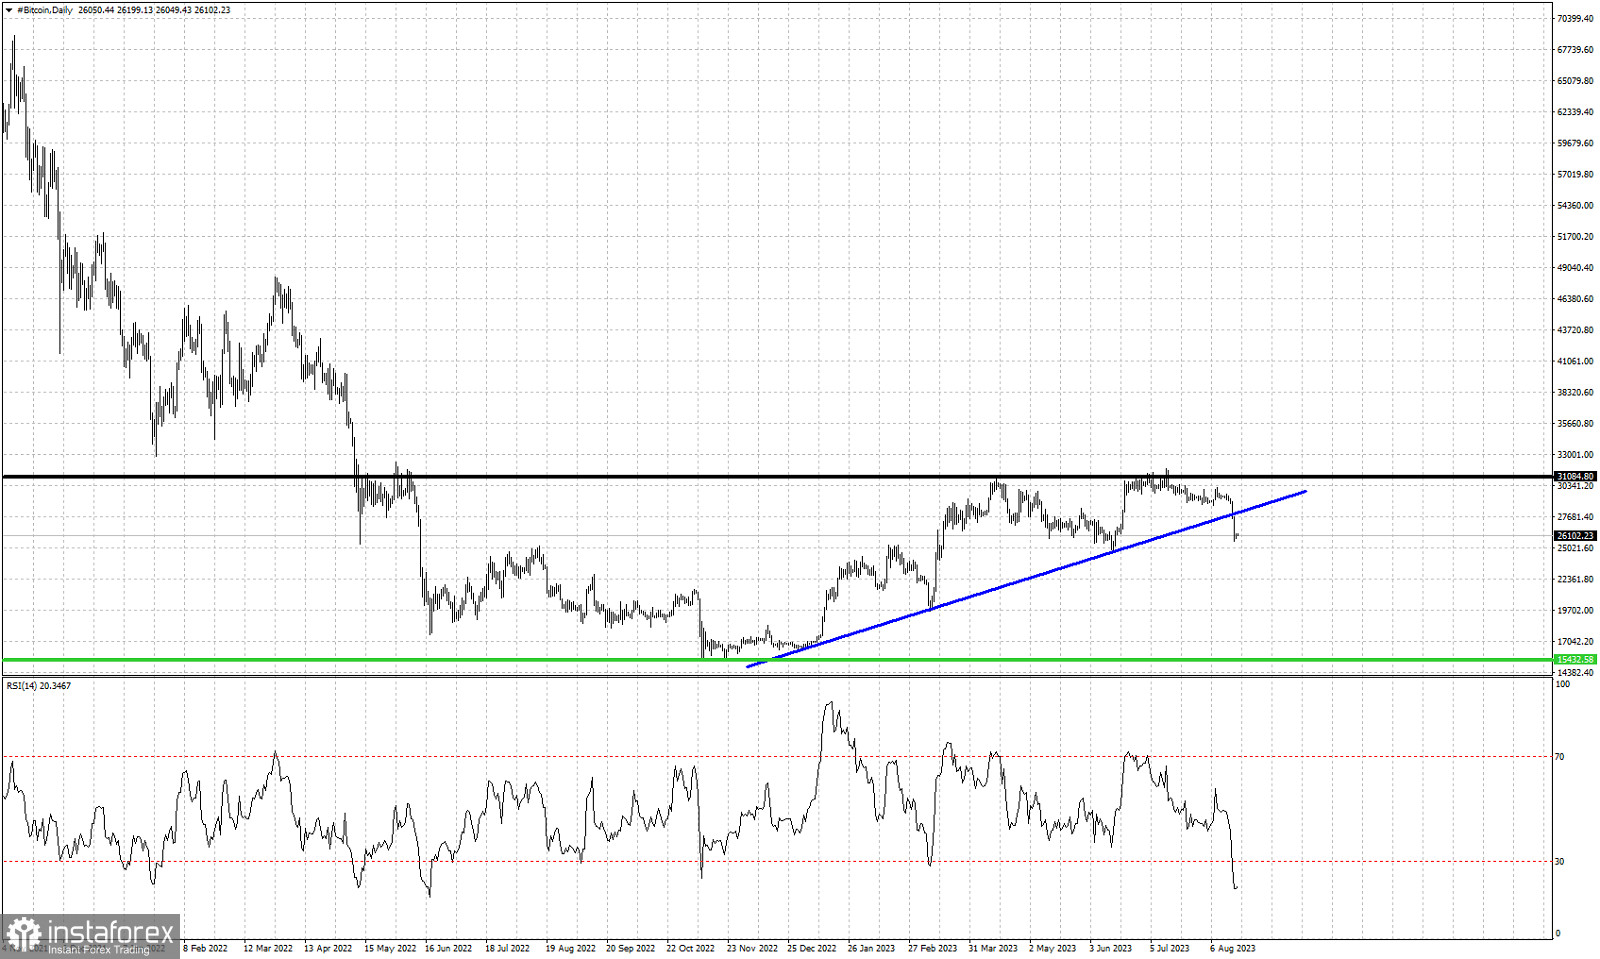
Black line -resistance
blue line- support (broken)
Green line- horizontal support
Bitcoin remains under pressure. Bitcoin price is now at $26,054. Over the last 4 sessions Bitcoin price has broken to new lows below a key upward sloping support trend line. The RSI has reached to new lows in oversold territory. Recent price action suggests that any bounce should be met with more selling and Bitcoin price remains vulnerable to more downside. In previous posts when Bitcoin was trying to break above the black horizontal resistance line, we warned about the bearish divergence signs and the bearish trap with the fake break out above $31,000. Price not only reached our short-term target (blue trend line), but has also broken below it. Price is vulnerable to a move lower towards the green line.
 English
 Русский
 Bahasa Indonesia
 Bahasa Malay
 ไทย
ไทย Español
 Deutsch
 Български
 Français
 Tiếng Việt
 中文
中文 বাংলা
বাংলা हिन्दी
 Čeština
 Українська
 Română

