 English
  Русский
 Bahasa Indonesia
 Bahasa Malay
 ไทย
ไทย Español
 Deutsch
 Български
 Français
 Tiếng Việt
 中文
中文 বাংলা
বাংলা हिन्दी
 Čeština
 Українська
 Română

EUR/USD
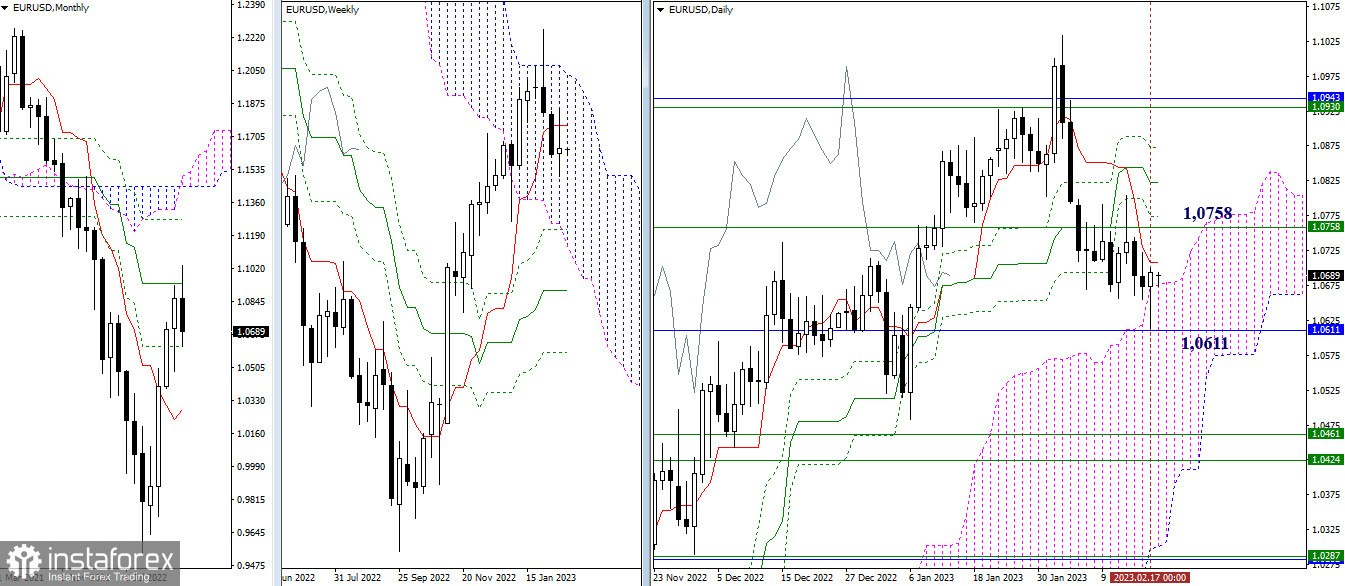
Higher time frames
On Friday, the pair tested the monthly support level at 1.0611 and rebounded from there on the daily chart. Still, the euro closed the week with a candlestick which does not clear up the situation. Today the pair is holding between the daily short-term trend at 1.0709 and the upper limit of the daily Ichimoku Cloud at 1.0675. In case bulls manage to develop an uptrend, the price may return to the weekly short-term trend at 1.0758. If bears prevail this time, the pair may again test the monthly support at 1.0611.

H4 – H1
On lower time frames, the pair is trading between the central daily pivot level of 1.0669 and the weekly long-term trend of 1.0698. This range is confirmed on the daily time frame. So, consolidation above or below its boundaries will have a significant effect on the pair. The next upward targets on the intraday chart are found at support formed by the standard pivot levels of 1.0724 – 1.0755 – 1.0810. As for downward targets, they are located at the support of the standard pivot levels of 1.0638 – 1.0583 – 1.0552.
***
GBP/USD

Higher time frames
The pair closed last week with a candlestick predicting uncertainty. The instrument is still trading inside the daily Ichimoku Cloud. Current daily targets remained the same. The main target for bears is the area of 1.1842 – 1.1795 (monthly level + lower boundary of the daily Ichimoku Cloud). The main upward targets for bulls are the daily levels of 1.2118 – 1.2092 supported by the weekly short-term trend at 1.2144.

H4 – H1
On lower time frames, the pound has settled above the central pivot level of 1.1999 and is set to head for the weekly long-term trend at 1.2064. Consolidation above this level and a reversal of the moving average can change the market balance on lower time frames. Additional intraday targets are found at the support of the standard pivot levels of 1.1952 – 1.1866 – 1.1819 and the resistance area of 1.2085 – 1.2132 – 1.2218).
***
Technical analysis is based on:
Higher time frames – Ichimoku Kinko Hyo (9.26.52) + Fibo Kijun levels
Lower time frames – H1: Pivot Points (standard) + 120-day Moving Average (weekly long-term trend)