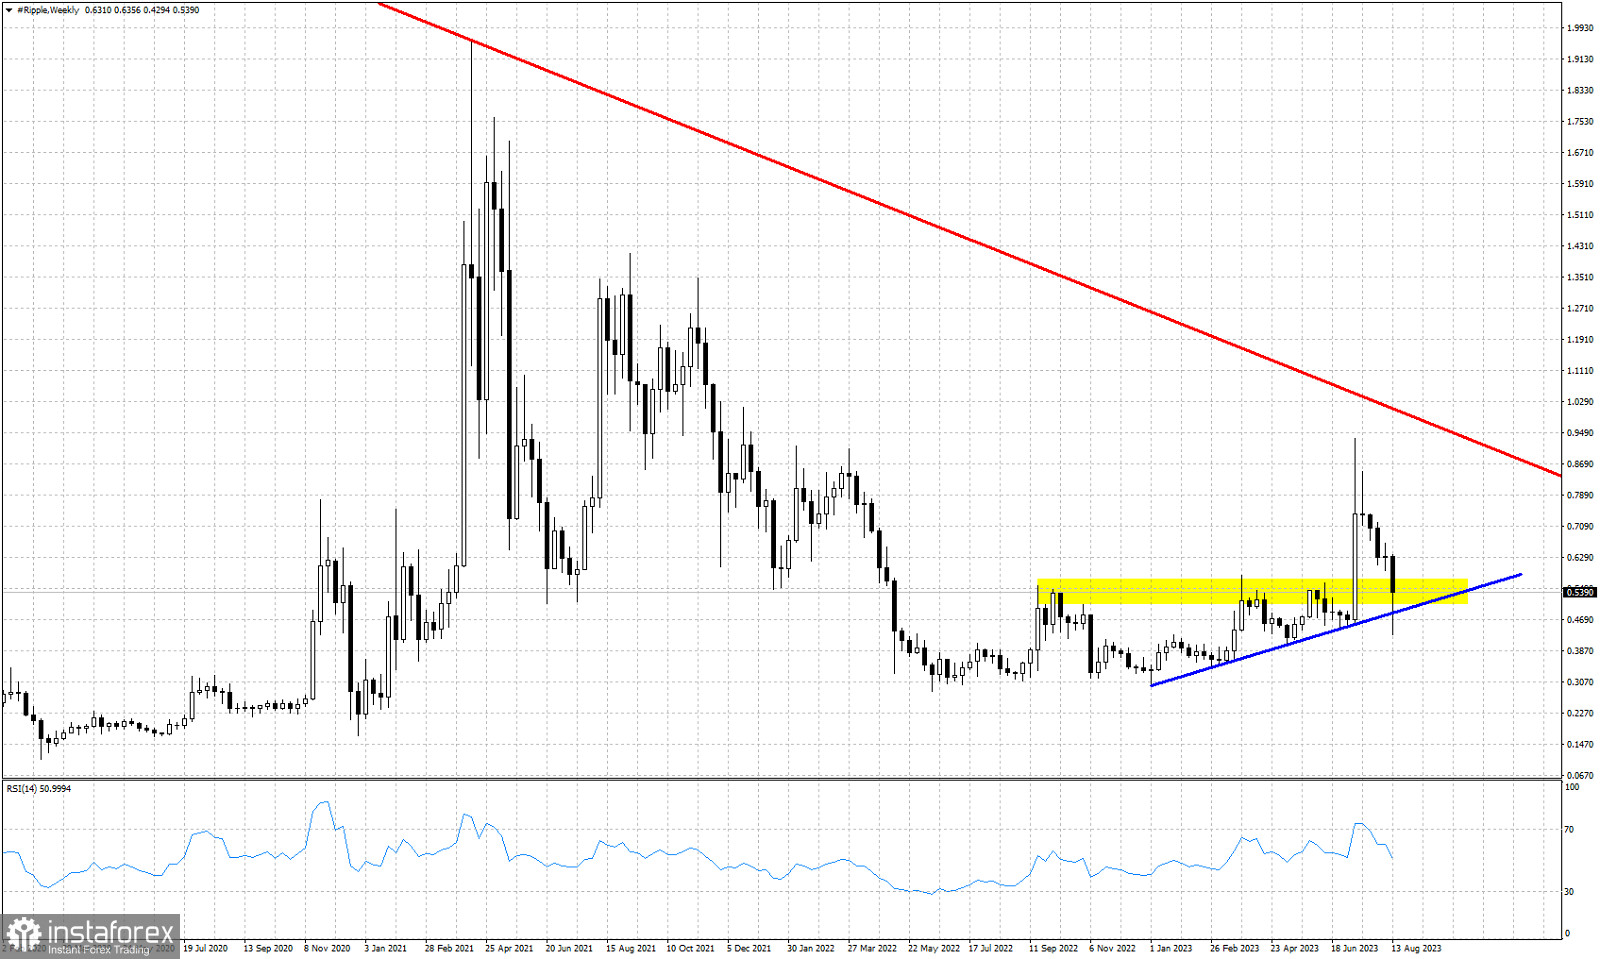
Red line - major resistance trend line
Yellow rectangle- previous resistance now support
Blue line- support trend line
XRPUSD remains under pressure as this week prices fall below key support levels. After the spike towards $1 we warned that price was still below the red major trend line and that a rejection could bring price back to support. XRPUSD is now at levels before the judge's ruling and the upward explosion in price. Technically XRPUSD remains vulnerable to new lows. This is the case as long as price remains below the red downward sloping long-term trend line. Price reached the major support area of $0.52. This was very important resistance before the break out. Price also briefly broke below the blue upward sloping support trend line. For now price remains inside the yellow rectangle. If this is a back test of the break out area, bulls will need to defend it and hold price above $0.48. Afterwards bulls will need to support price and help it bounce higher in order to gather momentum and start the next leg higher. Failure to hold above $0.48 could lead to new lows towards $0.30
 English
 Русский
 Bahasa Indonesia
 Bahasa Malay
 ไทย
ไทย Español
 Deutsch
 Български
 Français
 Tiếng Việt
 中文
中文 বাংলা
বাংলা हिन्दी
 Čeština
 Українська
 Română

