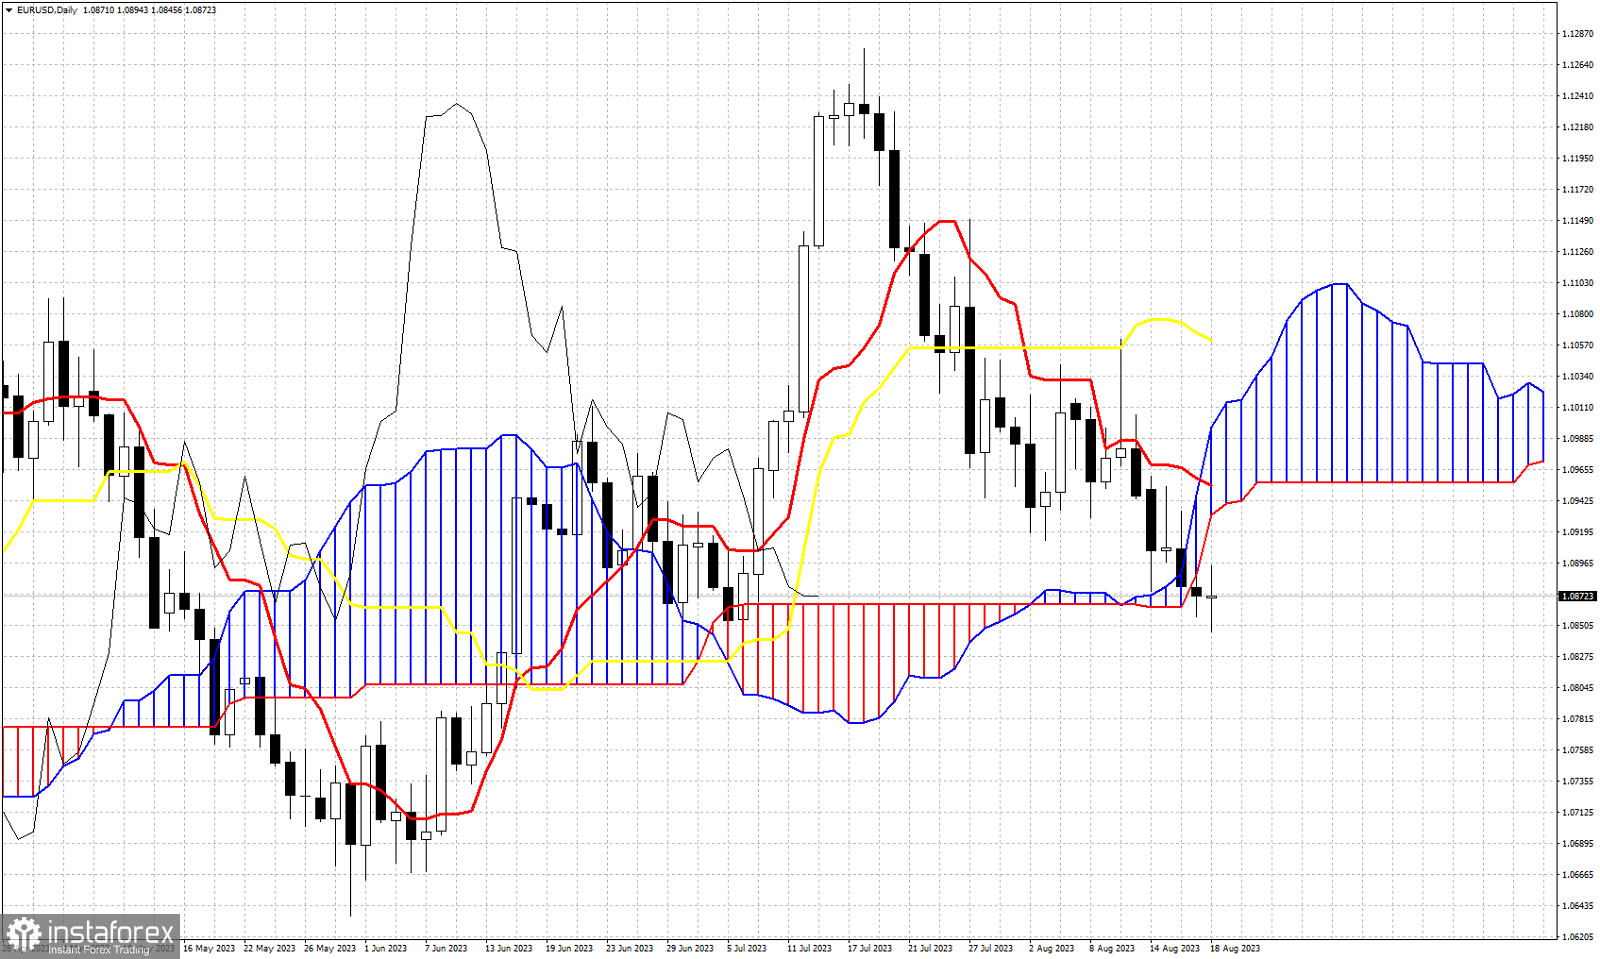
EURUSD ended the week with a second daily candlestick below the daily Kumo (cloud). According to the Ichimoku cloud indicator trend is now bearish. Price is below the cloud and in order for this to change, we need to see price break above 1.11. The Chikou span (black line indicator) has crossed below the candlestick pattern (bearish). The tenkan-sen (red line indicator) provides resistance at 1.0953 and the kijun-sen (yellow line indicator) at 1.1060. Short-term technical analysis shows that EURUSD is oversold in the near term, that is why we justify from current levels a bounce higher to back test the Kumo from below. At the beginning of the week we should not be surprised to see a bounce towards the lower cloud boundary at 1.0940. This is the most important short-term resistance now.
 English
 Русский
 Bahasa Indonesia
 Bahasa Malay
 ไทย
ไทย Español
 Deutsch
 Български
 Français
 Tiếng Việt
 中文
中文 বাংলা
বাংলা हिन्दी
 Čeština
 Українська
 Română

