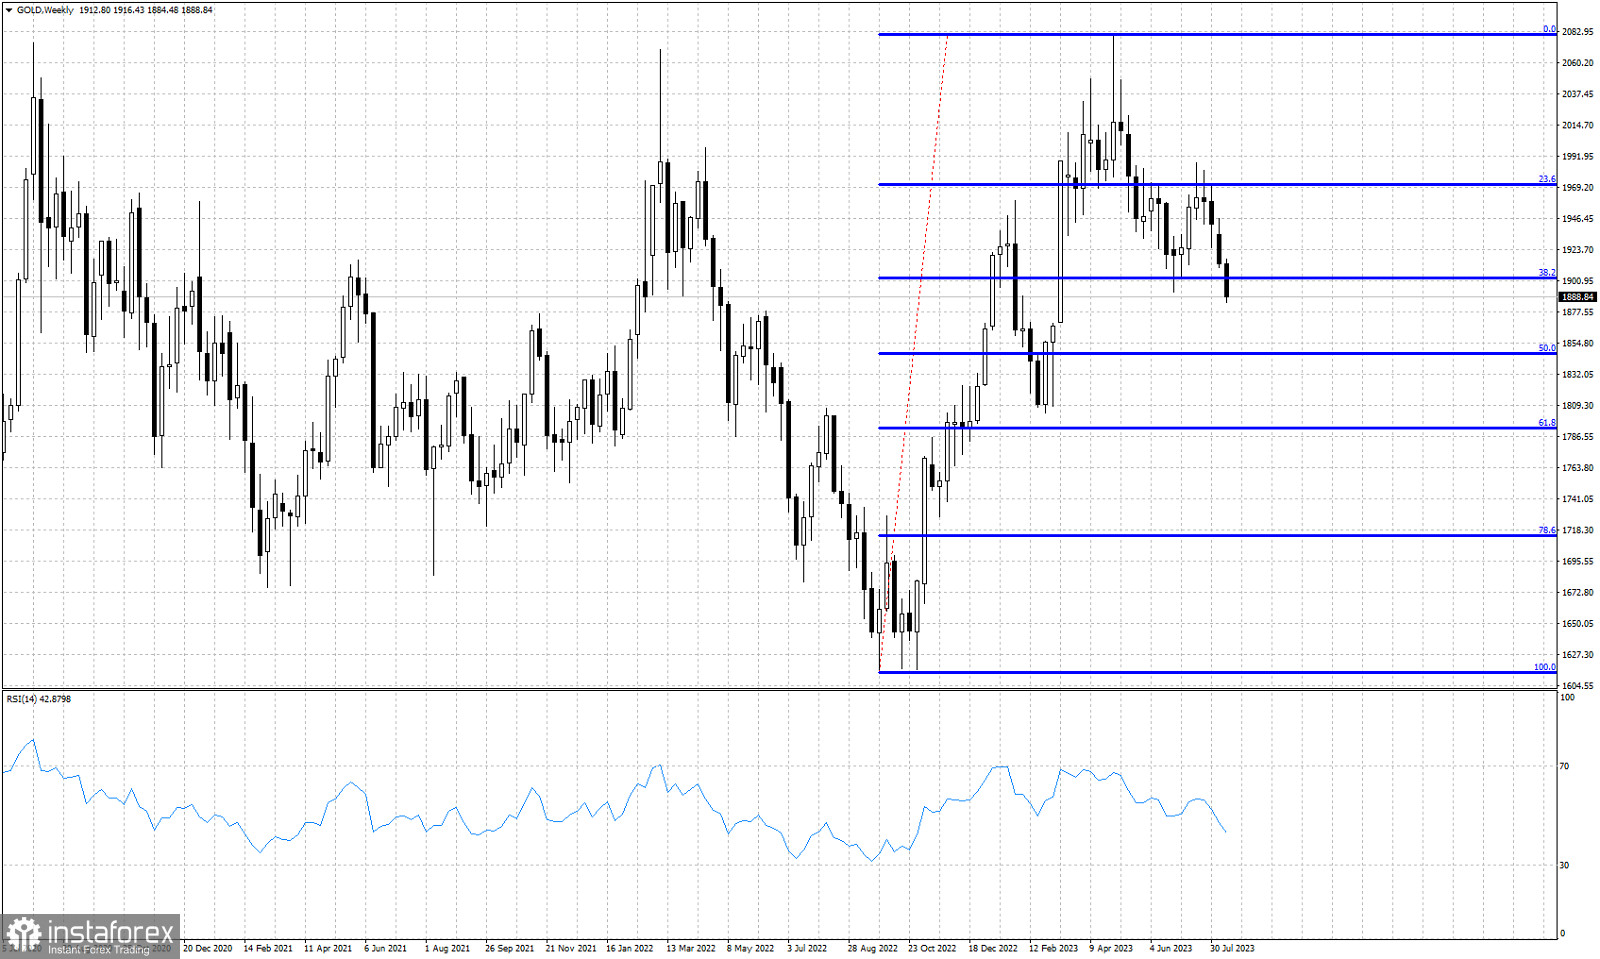
Blue lines- Fibonacci retracement levels
Gold price ended the week at a new lower low around $1,888. Short-term trend remains bearish as price continues making lower lows and lower highs. Recent price action suggests that the entire upward move from $1,614 low from 12 months ago is most probably complete and that a correction has started (bullish scenario). Gold price formed a weekly lower low relative to the past 20 weeks. Price has broken below the 38% Fibonacci retracement providing a fresh sign of weakness. Gold price is vulnerable to a move lower towards the 50% Fibonacci retracement level around $1,846. The bullish scenario suggests that this entire downward movement is a counter trend correction and that Gold price will form eventually a higher low, most probably around the 61.8% Fibonacci retracement. The bearish scenario suggests that Gold price has started a new downward wave that will eventually push price below $1,614. The recent lower high around $1,986 is the most important resistance level.
 English
 Русский
 Bahasa Indonesia
 Bahasa Malay
 ไทย
ไทย Español
 Deutsch
 Български
 Français
 Tiếng Việt
 中文
中文 বাংলা
বাংলা हिन्दी
 Čeština
 Українська
 Română

