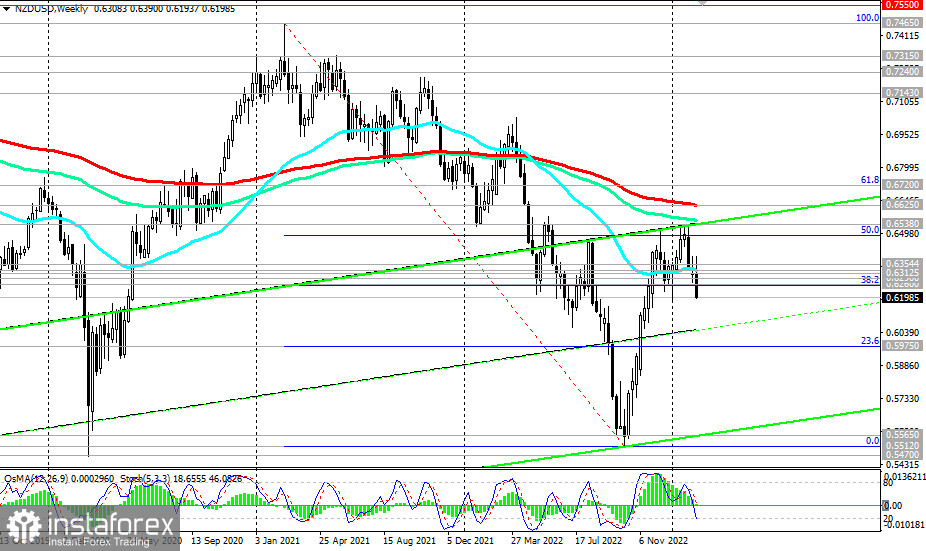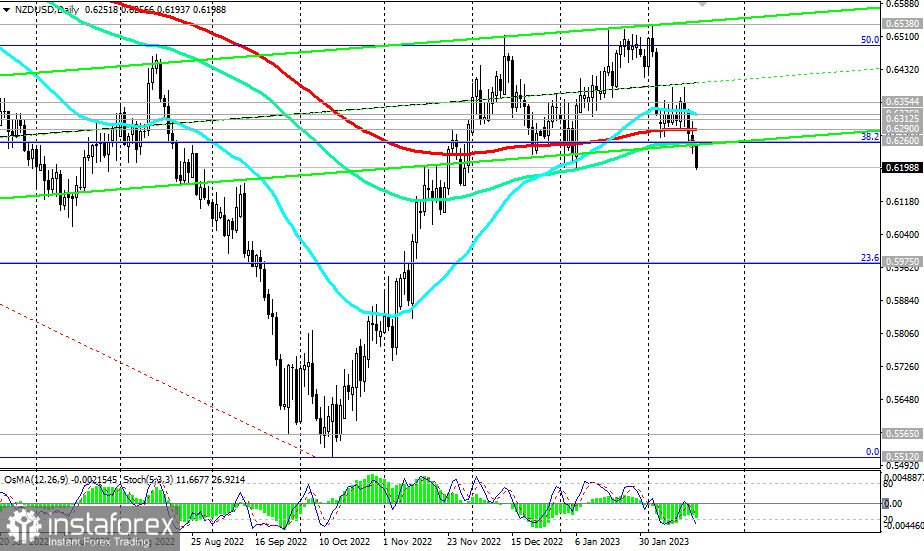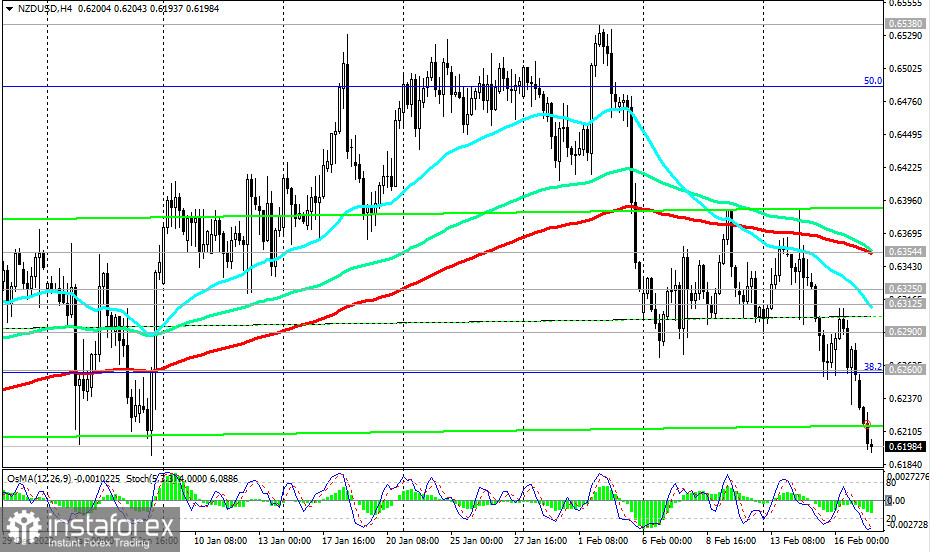
NZD/USD has broken two major medium-term support levels at 0.6290 (200 EMA on the daily chart) and 0.6260 (144 EMA on the daily chart and the 38.2% Fibonacci level in the pair's recent decline from 0.7465 in February 2012 to 0.5512, reached in October 2022). It continues to decline today, reaching a round mark of 0.6200 and deepening into the bear market zone.

Technical indicators OsMA and Stochastic on the daily and weekly charts also turned to short positions.
In an alternative scenario, a signal for the resumption of long positions will be an increase in the zone above the levels of 0.6260, 0.6290. In the meantime, short positions remain preferable. A break of the 0.6200 round mark will strengthen the downward dynamics of the pair.

Support levels: 0.6200, 0.6100, 0.6000, 0.5975, 0.5900
Resistance levels: 0.6260, 0.6290, 0.6312, 0.6325, 0.6355, 0.6400, 0.6500, 0.6538, 0.6600, 0.6625
Trading scenarios
Sell Stop 0.6190. Stop-Loss 0.6225. Take-Profit 0.6100, 0.6000, 0.5975, 0.5900
Buy Stop 0.6225. Stop-Loss 0.6190. Take-Profit 0.6260, 0.6290, 0.6312, 0.6325, 0.6355, 0.6400, 0.6500, 0.6538, 0.6600, 0.6625
 English
 Русский
 Bahasa Indonesia
 Bahasa Malay
 ไทย
ไทย Español
 Deutsch
 Български
 Français
 Tiếng Việt
 中文
中文 বাংলা
বাংলা हिन्दी
 Čeština
 Українська
 Română

