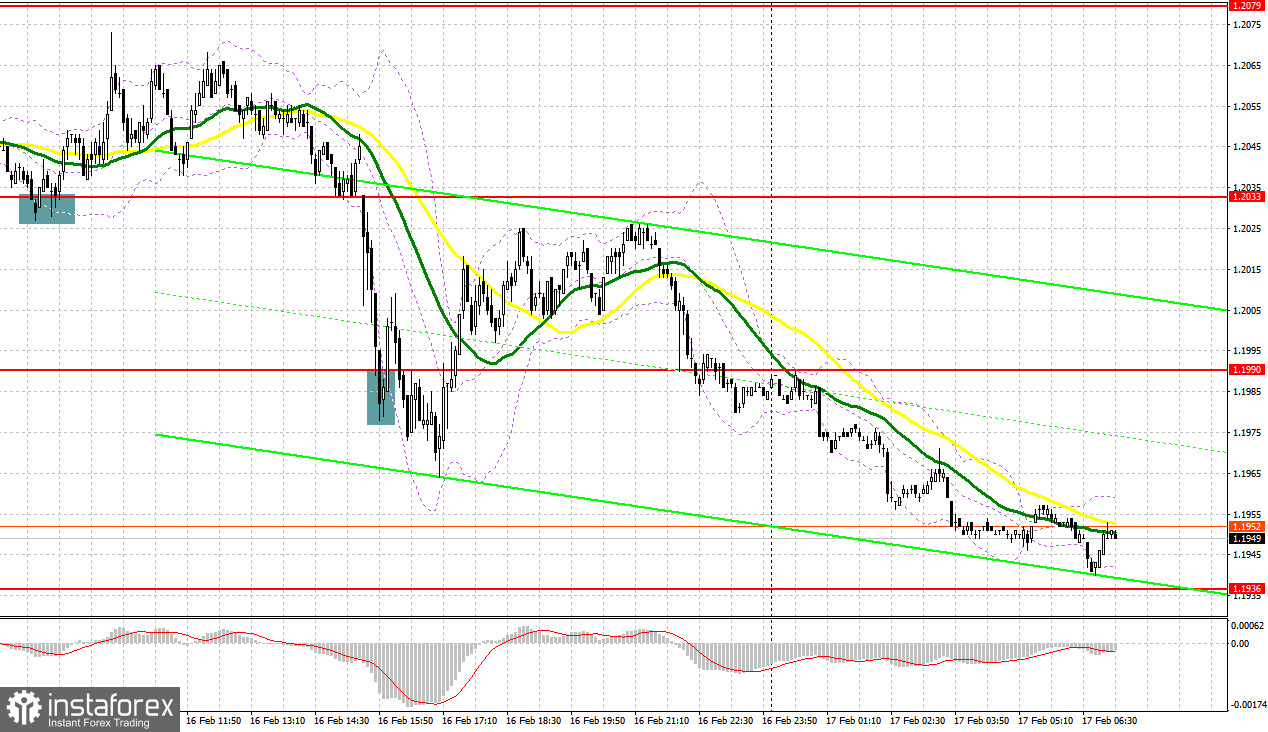
There were several market entry signals yesterday. Let us have a look at the 5-minute chart and figure out what happened. In my morning forecast I highlighted the level of 1.2033 and recommended making trading decisions with this level in mind. The pound sterling performed a false breakdown of 1.2033 after retreating slightly amid the lack of statistic data. This created an excellent buy signal, pushing the pair up by almost 40 pips. In the second half of the day, the pair broke below 1.2033 and did not perform an upward retest, making 1.1990 a key level. A false breakout of that level created a sell signal, but the pair failed to rebound immediately. Bulls only managed to regain 1.1990 later after a larger correction that triggered my stop-loss orders.

When to open long positions on GBP/USD:
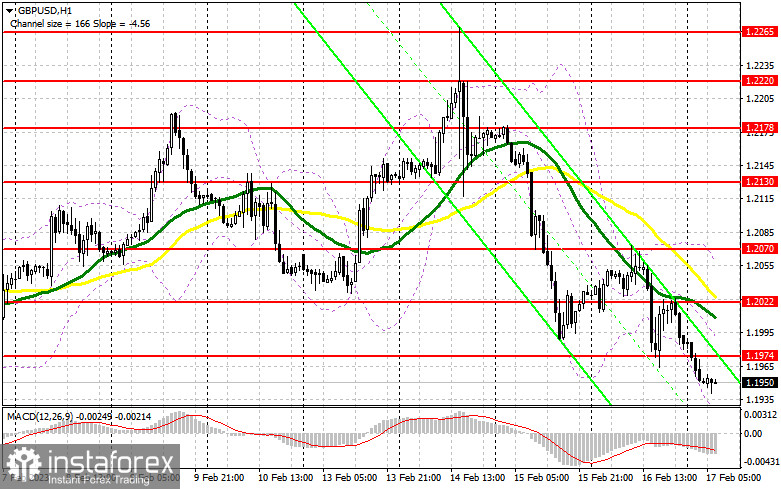
Today's key data release is the UK retail sales data for January. Sales were initially forecast to decrease slightly. If the final data is greater than anticipated, it could increase inflationary pressure and help the pound sterling in the short term. Disappointing retail sales will maintain pressure on GBP/USD. In this situation, long positions can be considered after the pair hits its closest support at 1.1919. I will monitor the activity of bulls in this area if the pair performs a false breakout of this level. Such a breakout will create a buy signal targeting 1.1974. If GBP/USD settles above it and performs a downward retest of this level, it may then continue to climb towards the high at 1.2022. Above it lie the moving averages that favor bearish traders. From there it may move to 1.2070, where I would take profit. If bulls lose 1.1919, which is possible even at the end of the week given the current bear market, pressure on GBP/USD will increase. In this situation long positions should only be opened during a false breakout of the next support level of 1.1875. I will buy GBP/USD immediately if it bounces off 1.1829, targeting an intraday correction of 30-35 pips intraday.
When to open short positions on GBP/USD:
Bears are in control of the market, and they need to break below the closest support at 1.1919 to increase their dominance. Another important level for bearish traders is 1.1974. A false breakout of that level will create a sell signal and push GBP/USD down to 1.1919. A breakout and a retest of this area, alongside hawkish remarks by Fed policymakers on the need to continue hiking interest rates, will ruin the bulls' plans to return to the market after yesterday's sell-off. This would reinforce the bears' position in the market, and create a sell signal. The pair may drop to 1.1875 afterwards. The most distant target is 1.1829, which will indicate an extension of the downtrend. I will take profits there. If GBP/USD rises and bears are idle at 1.1974, market participants may start taking profits at the end of the week. In that case, bears will retreat and again wait for positive news on US economic growth. Only a false breakout of the next resistance level of 1.2022 will form an entry point for opening short positions. If there is no activity there, I will sell GBP/USD immediately if it bounces off 1.2070, expecting an intraday rebound of 30-35 pips.

Commitment of Traders (COT) report:
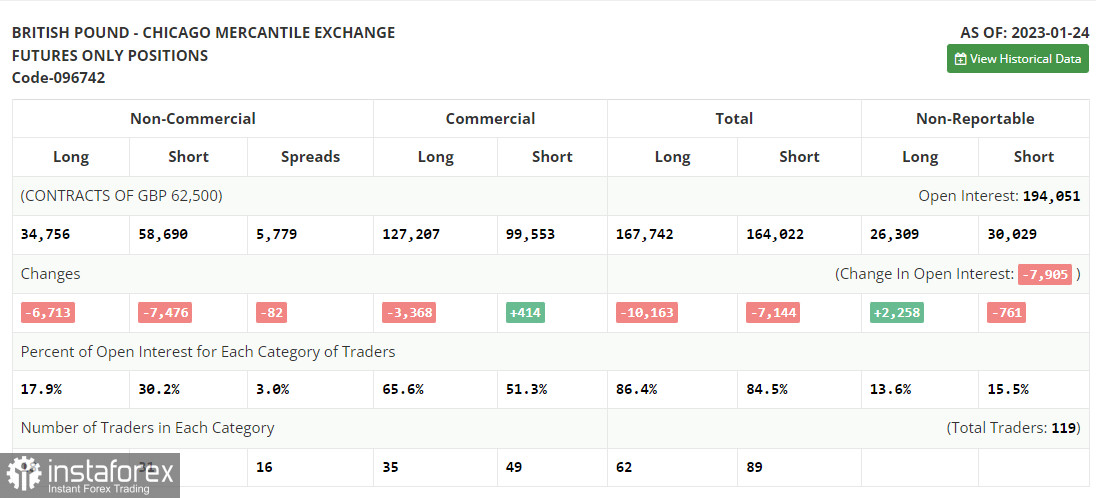
The CFTC has not yet published any new COT reports due to technical problems that began more than two weeks ago. Here is the latest published report from January 24.
The Commitment of Traders (COT) report for January 24 indicated that both long and short positions declined sharply. However, the current decline was within acceptable limits, especially given the problems the UK government is currently experiencing. British politicians are struggling with strikes and wage demands, while at the same time trying to get inflation down steadily. The latest COT report showed that short non-commercial positions fell by 7,476 to 58,690, whereas long non-commercial positions fell by 6,713 to 34,756, bringing the negative non-commercial net position down to -23,934 from -24,697 the week before. Such minor fluctuations do not make much difference to the current situation, so it will be a good idea to keep a close eye on the UK economic data and the Bank of England's policy decision. The weekly closing price rose to 1.2350 compared to 1.2290 a week earlier.

Indicators' signals:
Moving averages
Trading is carried out below the 30-day and 50-day moving averages, indicating that the pound sterling is likely to drop even lower in the future.
Note: The period and prices of moving averages are considered by the author on the H1 (1-hour) chart and differ from the general definition of the classic daily moving averages on the daily D1 chart.
Bollinger Bands
If GBP/USD rises, it will encounter resistance at the upper boundary of the indicator near 1.2030. If the pair declines, the lower boundary near 1.1919 will provide it support.
Description of indicators
Moving average (moving average, determines the current trend by smoothing out volatility and noise). Period 50. It is marked yellow on the chart. Moving average (moving average, determines the current trend by smoothing out volatility and noise). Period 30. It is marked green on the chart. MACD indicator (Moving Average Convergence/Divergence - convergence/divergence of moving averages) Quick EMA period 12. Slow EMA period to 26. SMA period 9 Bollinger Bands (Bollinger Bands). Period 20 Non-commercial speculative traders, such as individual traders, hedge funds, and large institutions that use the futures market for speculative purposes and meet certain requirements. Long non-commercial positions represent the total long open position of non-commercial traders. Short non-commercial positions represent the total short open position of non-commercial traders. Total non-commercial net position is the difference between the short and long positions of non-commercial traders. English
 Русский
 Bahasa Indonesia
 Bahasa Malay
 ไทย
ไทย Español
 Deutsch
 Български
 Français
 Tiếng Việt
 中文
中文 বাংলা
বাংলা हिन्दी
 Čeština
 Українська
 Română

