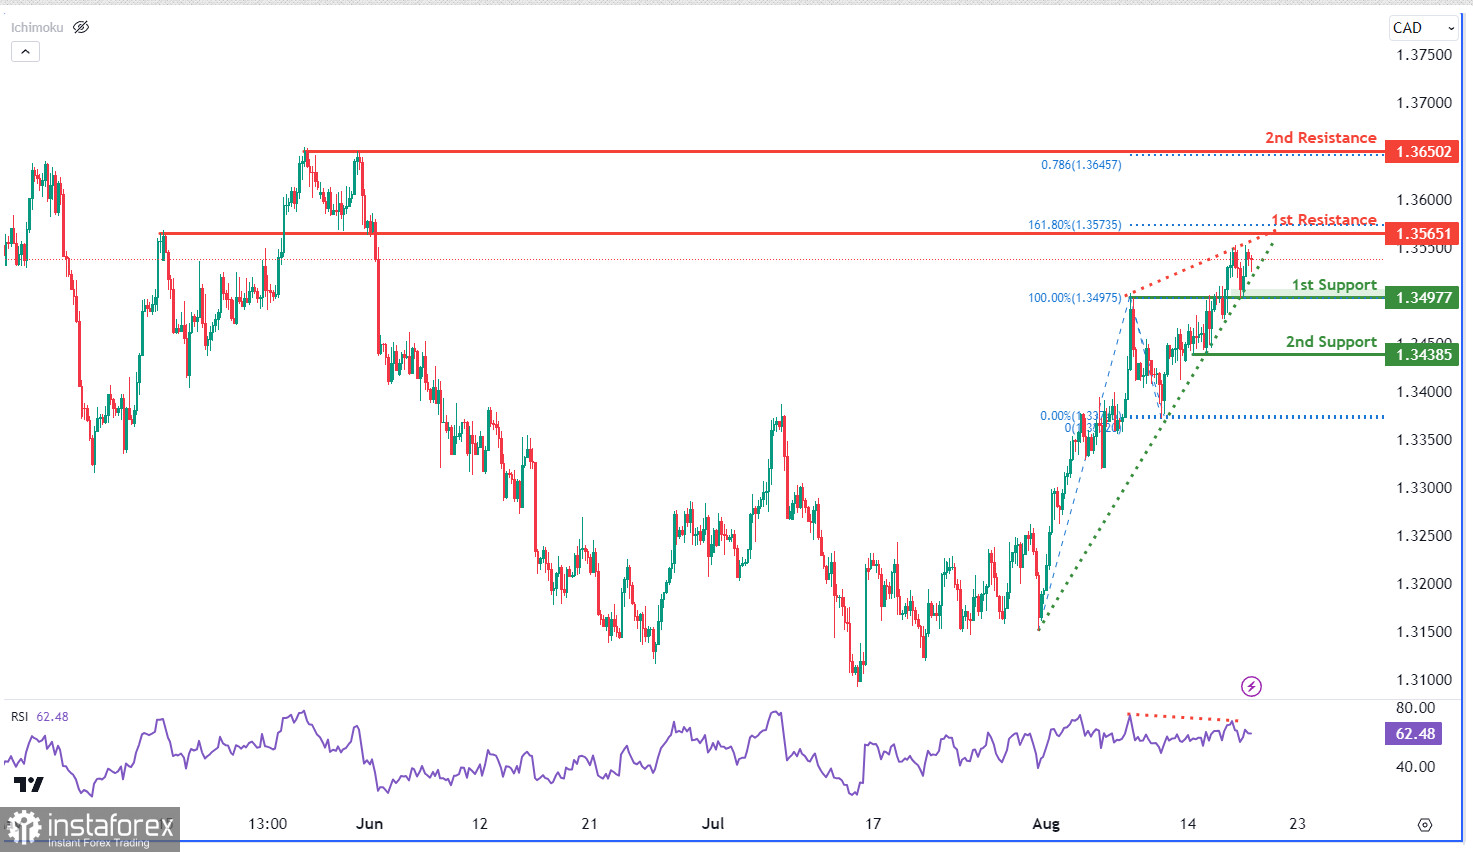
The USD/CAD chart displays a bearish trend, reinforced by an RSI indicator showing bearish divergence with the price. The price might descend towards the 1st support at 1.3498 and the 2nd support at 1.3387, both being overlap supports. Conversely, the 1st resistance at 1.3565 aligns with the 161.80% Fibonacci extension, and the 2nd resistance at 1.3650 matches the 78.60% Fibonacci projection, indicating as a multi-swing high resistance.
Separately, a rising wedge is a reversal indicator often seen in bear markets. This pattern appears when prices rise with converging pivot highs and lows towards an apex. If paired with diminishing volume, it can hint at a bear market continuation.
 English
 Русский
 Bahasa Indonesia
 Bahasa Malay
 ไทย
ไทย Español
 Deutsch
 Български
 Français
 Tiếng Việt
 中文
中文 বাংলা
বাংলা हिन्दी
 Čeština
 Українська
 Română

