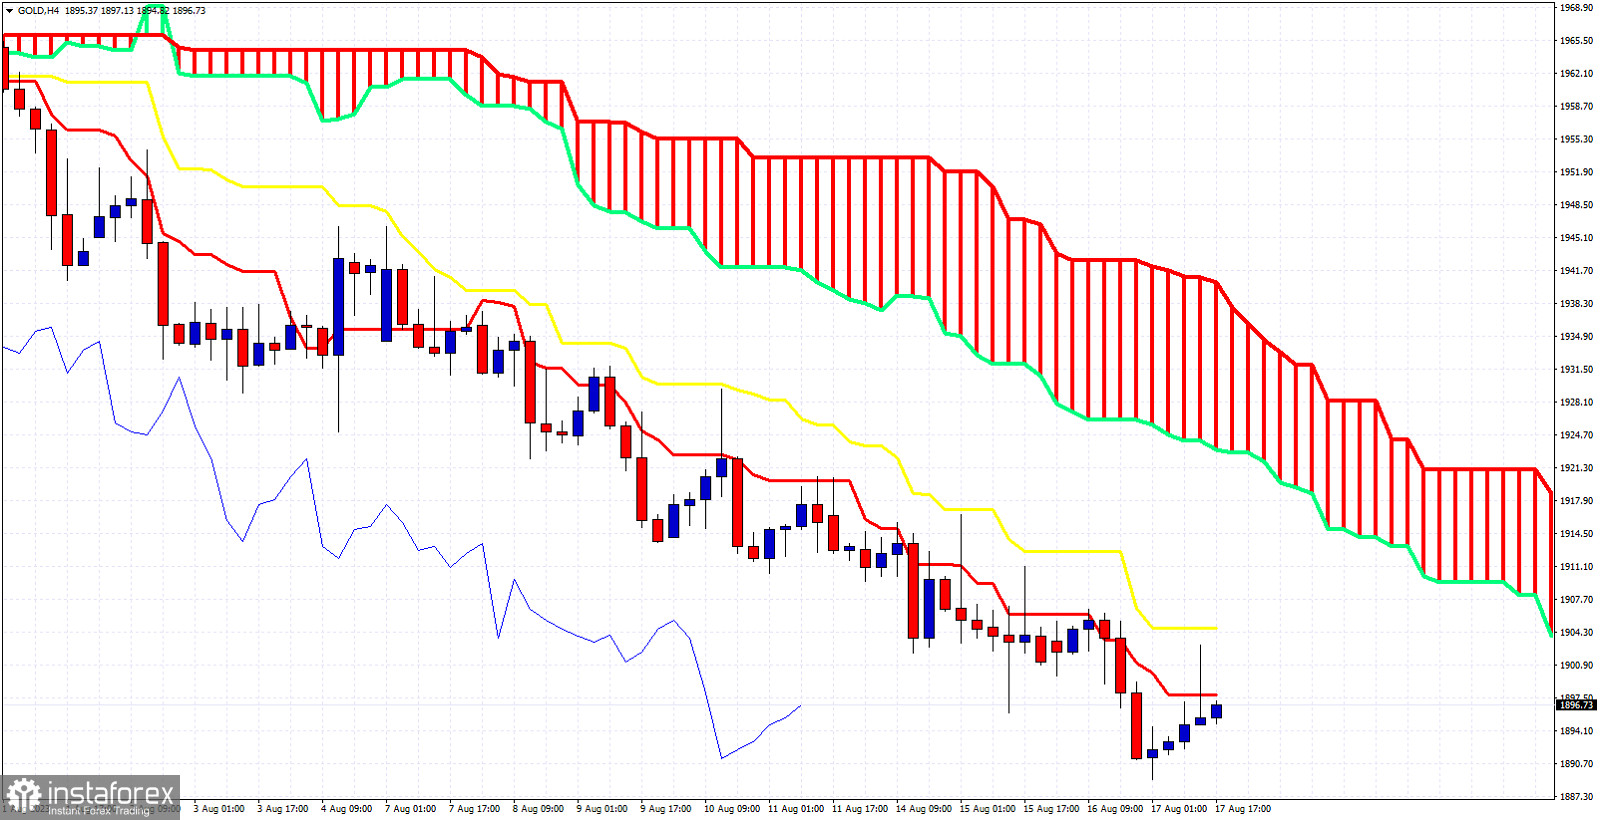
Gold price is trading below $1,900 after briefly breaking below the June lows of $1,892. Technically trend remains bearish as price continues making lower lows and lower highs. Today we use the Ichimoku cloud indicator to identify key resistance levels in the near term. In the 4 hour chart price remains below both the tenkan-sen (red line indicator) and the kijun-sen (yellow line indicator). The tenkan-sen provides resistance at $1,897 and the kijun-sen at $1,904. The Chikou span (blue line indicator) is below the candlestick pattern (bearish) and suggests that resistance is found at $1,912. The Kumo provides resistance at $1,920. In the near term price could bounce towards that level. If Gold price breaks above $1,904, then we will get a first sign of reversal and the start of the bounce. Until then we should expect Gold to continue making lower lows and lower highs.
 English
 Русский
 Bahasa Indonesia
 Bahasa Malay
 ไทย
ไทย Español
 Deutsch
 Български
 Français
 Tiếng Việt
 中文
中文 বাংলা
বাংলা हिन्दी
 Čeština
 Українська
 Română

