 English
  Русский
 Bahasa Indonesia
 Bahasa Malay
 ไทย
ไทย Español
 Deutsch
 Български
 Français
 Tiếng Việt
 中文
中文 বাংলা
বাংলা हिन्दी
 Čeština
 Українська
 Română

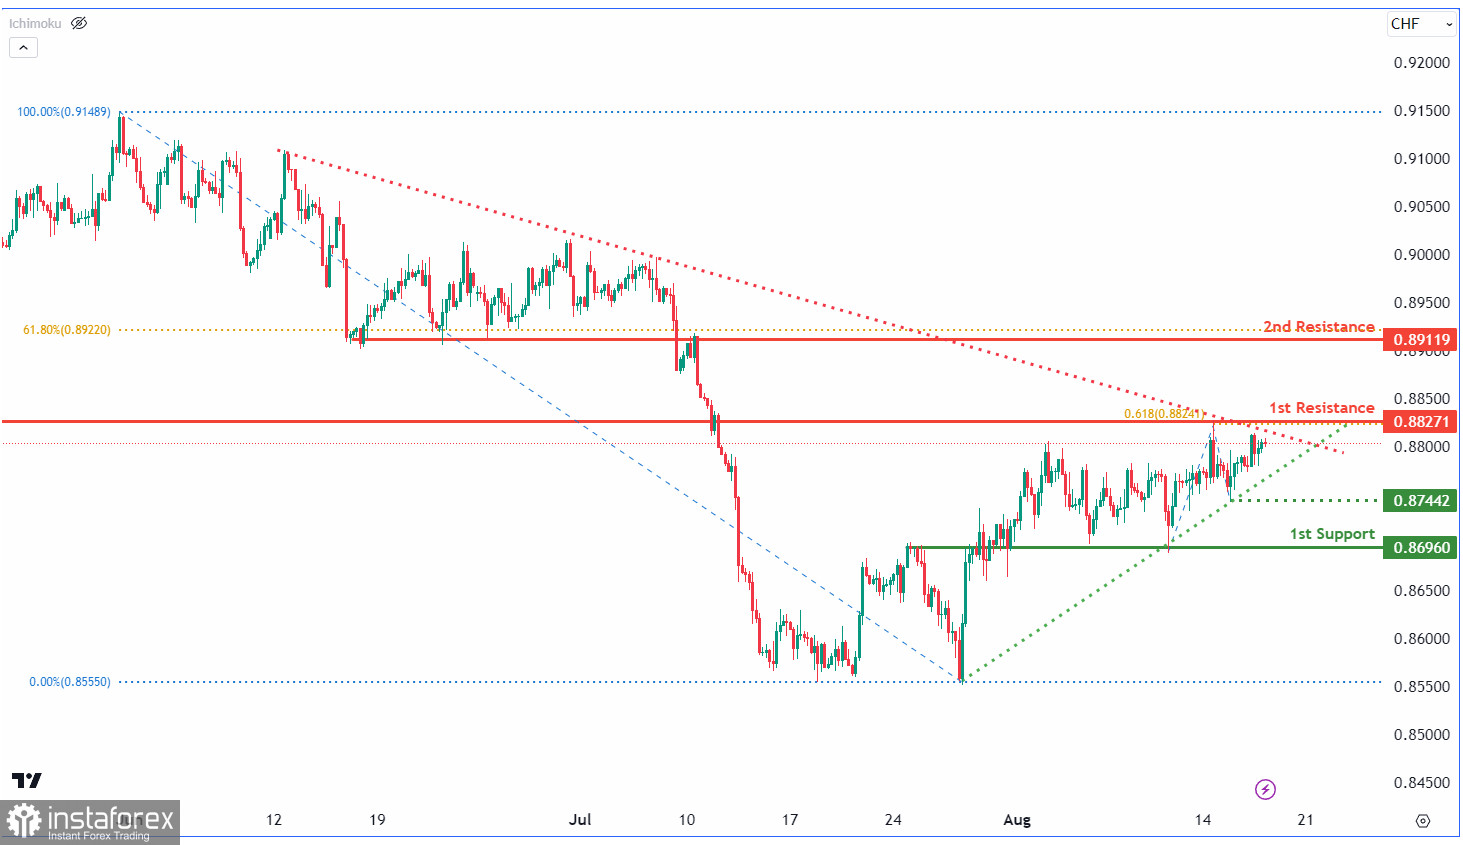
The USD/CHF chart shows a neutral trend, likely fluctuating between 0.8827 1st resistance and 0.8696 1st support. Key levels include overlap supports and resistances, and a pullback resistance at 0.8911. The chart features a symmetrical triangle, hinting at upcoming consolidation before a possible breakout. This suggests impending volatility and a potential decisive shift in either direction.