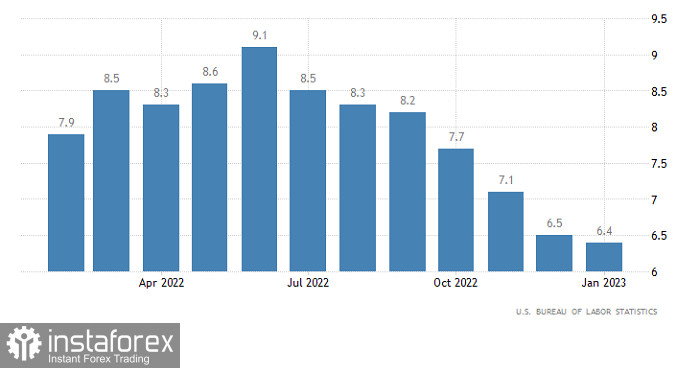
Yesterday things did not go according to plan and instead of going down, the single European currency grew during the European trading session. And the reason was the UK labor market report, which turned out to be much better than expected and the unemployment rate remained unchanged, while it was expected to rise from 3.7% to 3.8%. The pound instantly started to rise and pulled along the euro. After the opening of the US trading session, the direction of the single currency completely turned around. Although, in the morning it seemed that it would grow during the US trading session, and the inflation data was expected to be the reason for that. Consumer price growth was expected to slow from 6.5% to 6.3%, which should have brought hope for a more modest scale of monetary tightening by the Federal Reserve. But inflation fell only to 6.4%. Moreover, yesterday the U.S. central bank, while not giving any specifics as to the number of interest rate hikes to come, outright rejected the very idea of a possible reduction in the refinancing rate in the foreseeable future.
Inflation (United States):

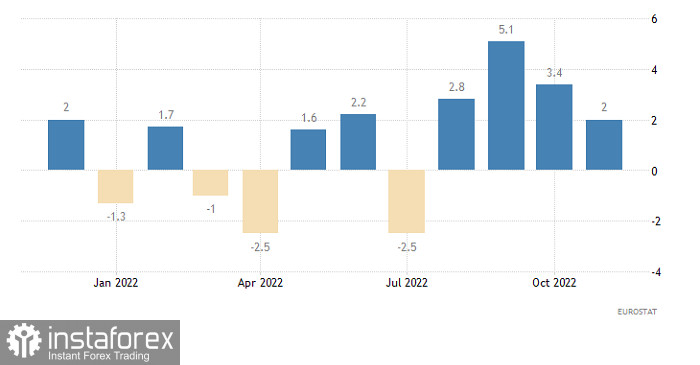
Today, the euro is likely to continue losing its positions. At least during the European trading session. In the eurozone itself, the industrial production growth, which currently stands at 2.0%, is likely to be replaced by a decline of 0.3%. But the scale of the decrease will be relatively modest, as the overbought dollar will have a restraining effect.
Industrial production (Europe):

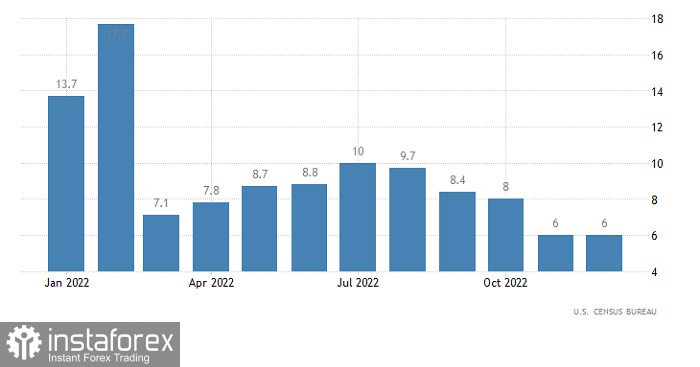
But after the opening of the US trading session, the quotes will likely return to the values in which it started the day. This is due to the US data. Firstly, the growth rate of retail sales should slow down from 6.0% to 4.5%. Secondly, the industrial production growth may slow down from 1.6% to 1.1%.
Retail Sales (United States):

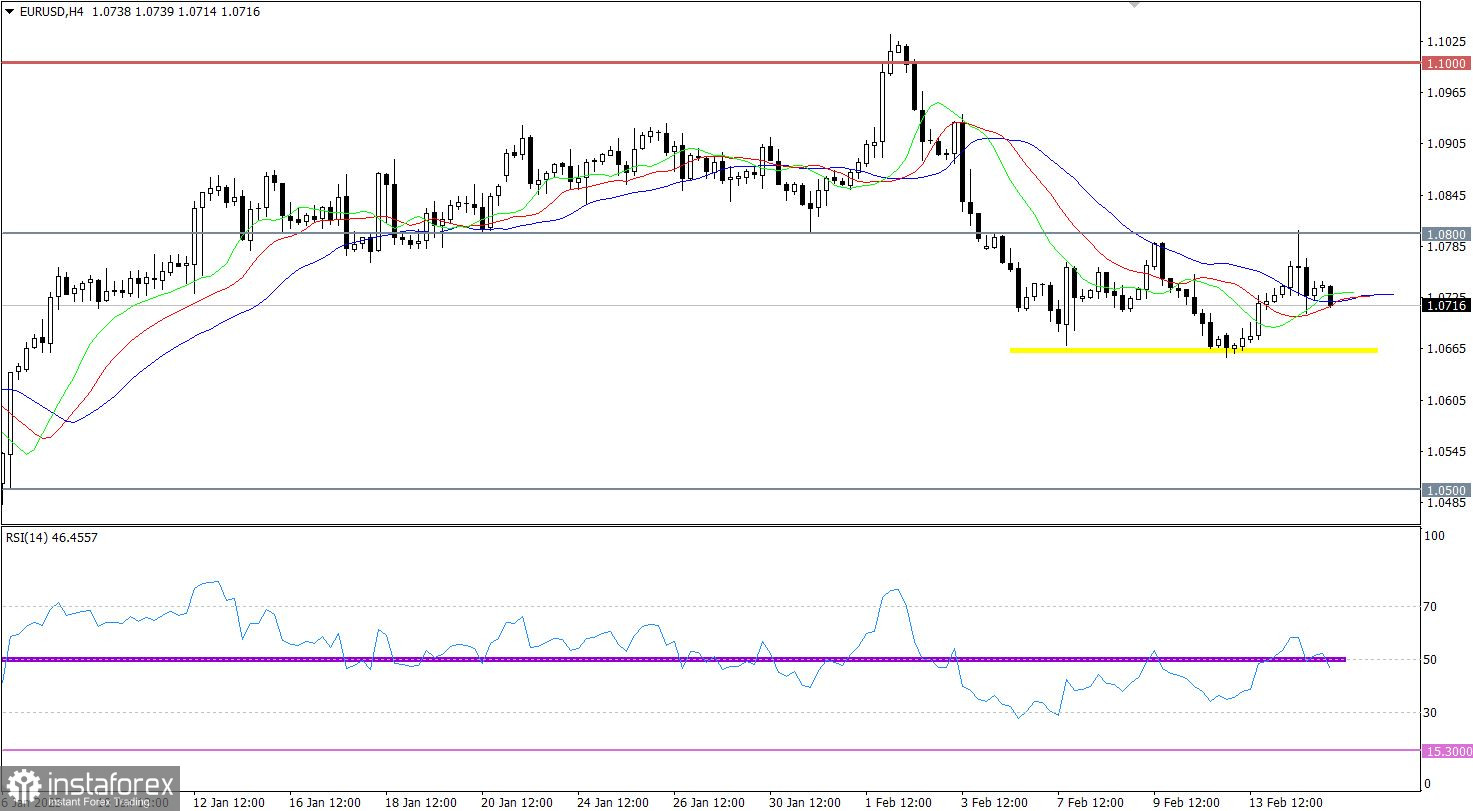
EUR/USD reached 1.0800, and the number of long positions has fallen. This led to a rebound in price, which was accompanied by speculative bounces.
On the four-hour chart, the RSI technical indicator is within the average level of 50, which indicates stagnation. On the daily chart, it is hovering in the lower area of 30/50, this is a residual signal from the correctional movement.
On the four-hour and daily charts, the Alligator's MAs are intertwined with each other, which proves stagnation.

Outlook
Based on the fluctuation cycle in 6 trading days, the pair has been moving sideways in the limits of 1.0670/1.0800. This move may well be a process of accumulation of trading strength, which will eventually lead to a downward momentum.
In terms of the complex indicator analysis, we see that in short-term and intraday periods, indicators are signaling sell opportunities since the price bounced from 1.0800.
 English
 Русский
 Bahasa Indonesia
 Bahasa Malay
 ไทย
ไทย Español
 Deutsch
 Български
 Français
 Tiếng Việt
 中文
中文 বাংলা
বাংলা हिन्दी
 Čeština
 Українська
 Română

