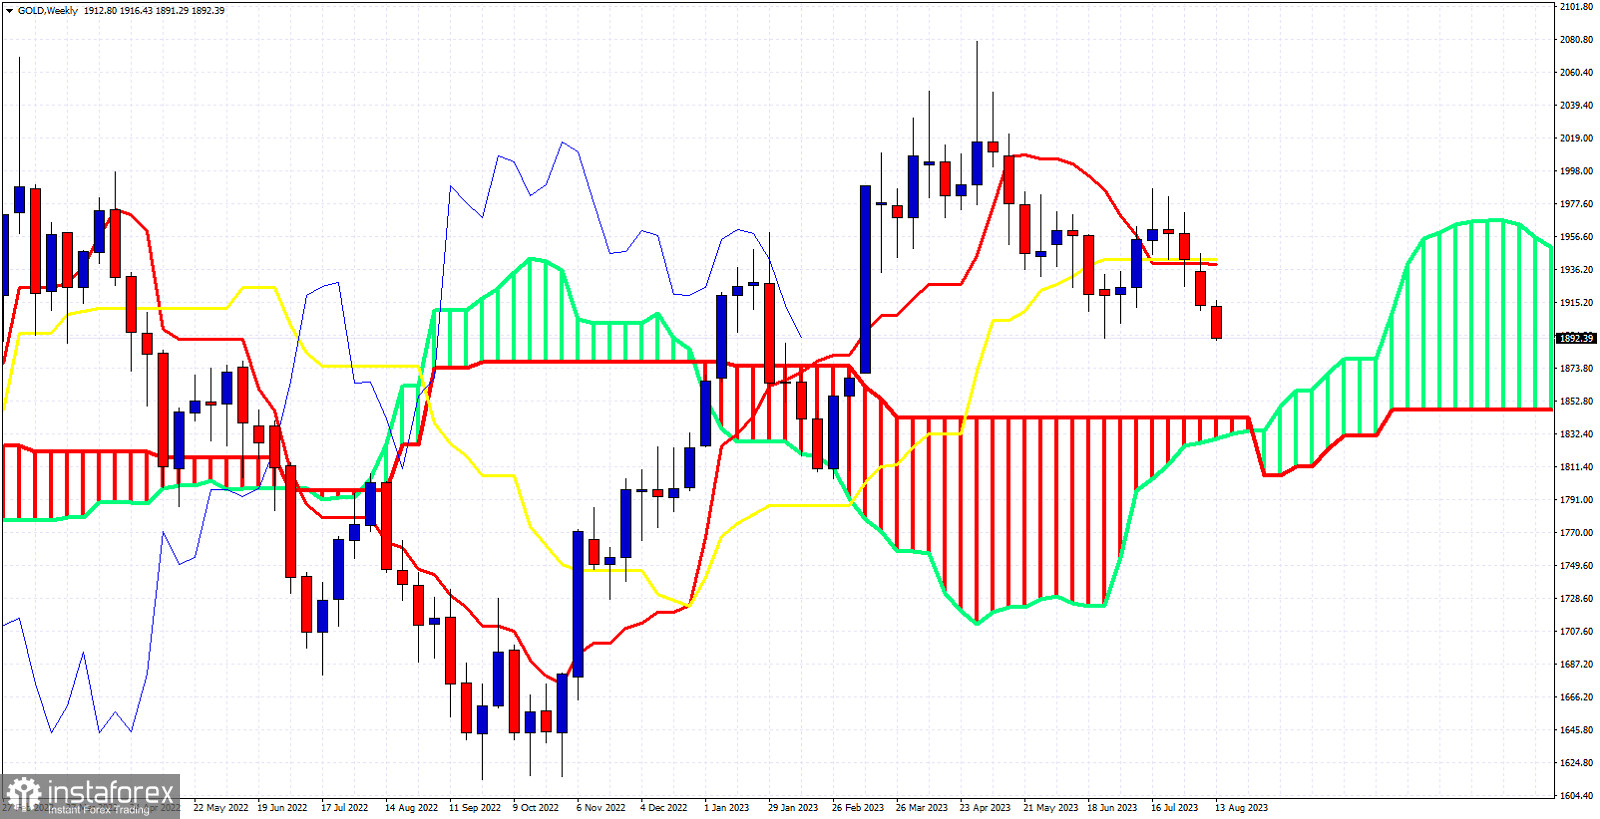
 analysis, the weekly chart with the Ichimoku cloud indicator continue to suggest that price is vulnerable to a move lower towards the weekly Kumo (cloud) at $1,842. The tenkan-sen (Red line indicator) and the kijun-sen (yellow line indicator) are above current market price and provide resistance at $1,940. Bulls need a weekly close above this level in order to hope for another bullish wave higher. Until then price will remain vulnerable to a move lower. The Chikou span (blue line indicator) remains above the candlestick pattern (bullish) but with a negative slope making lower lows and lower highs. Short-term support is now at $1,877.
FX.co ★ Ichimoku cloud indicator analysis on Gold for week starting August 14th, 2023.
 Relevance until
Ichimoku cloud indicator analysis on Gold for week starting August 14th, 2023.
*The market analysis posted here is meant to increase your awareness, but not to give instructions to make a trade
 English
 Русский
 Bahasa Indonesia
 Bahasa Malay
 ไทย
ไทย Español
 Deutsch
 Български
 Français
 Tiếng Việt
 中文
中文 বাংলা
বাংলা हिन्दी
 Čeština
 Українська
 Română
