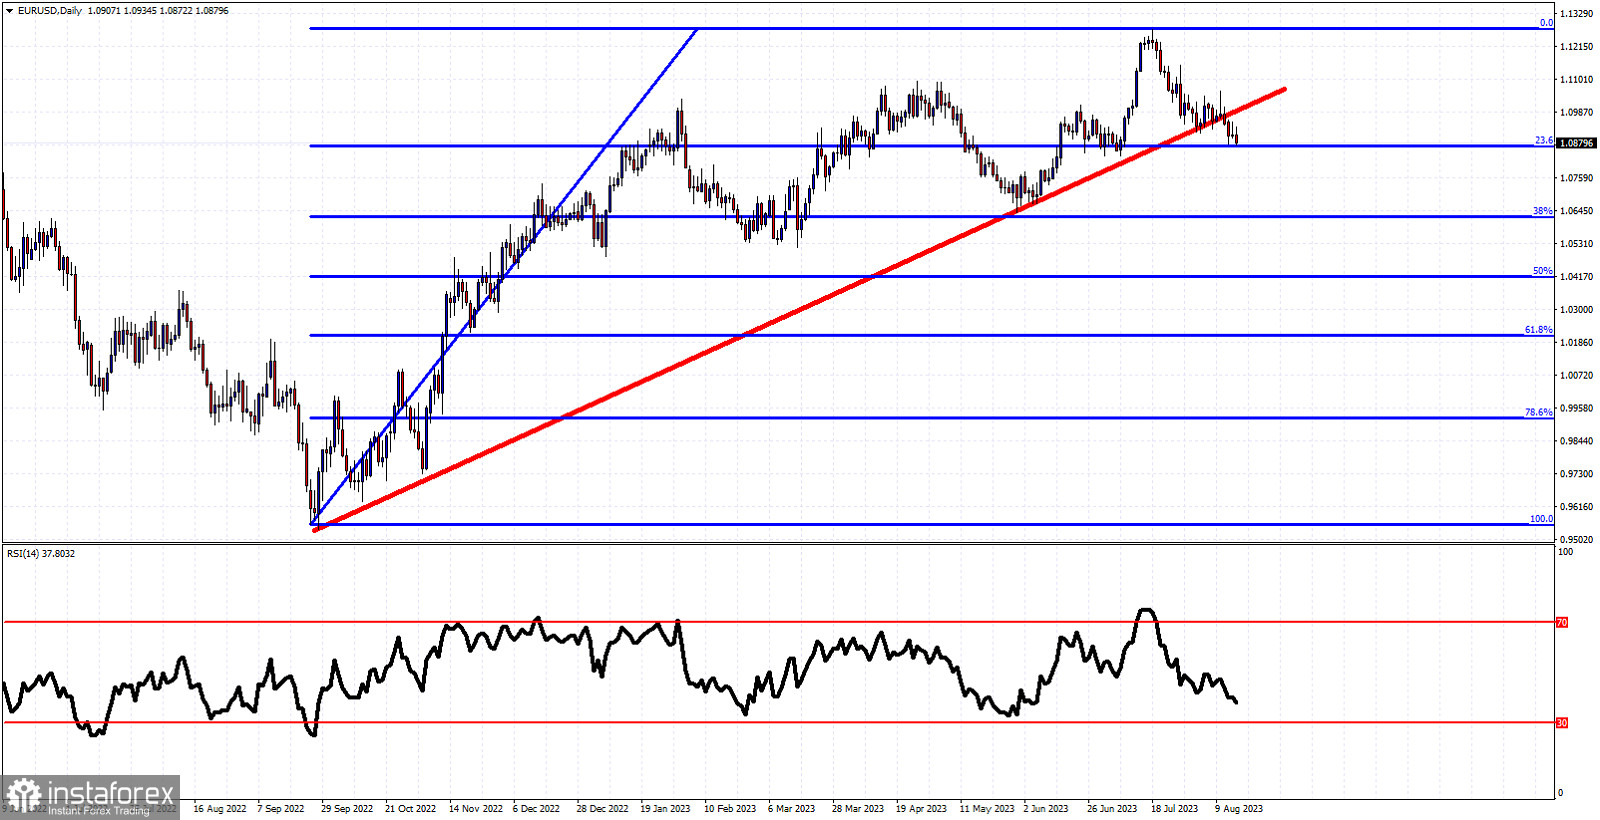
Blue lines - Fibonacci retracement levels
Red line- support trend line
EURUSD remains under pressure. Price today is trading below 1.09 around 1.0880. Price has broken the red upward sloping support trend line coming from the 2022 lows below parity. Short-term trend remains bearish as price continues making lower lows and lower highs. Price has most probably completed the entire upward move from 0.95. So far price has retraced 23.6% of the rise and the break below the red support trend line, has provided us with a new bearish signal. This bearish signal implies that there are now increased chances of a move lower towards the next Fibonacci retracement level at 1.0620. Resistance is found at 1.1060 and as long as we trade below this level, short-term trend is controlled by bears.
 English
 Русский
 Bahasa Indonesia
 Bahasa Malay
 ไทย
ไทย Español
 Deutsch
 Български
 Français
 Tiếng Việt
 中文
中文 বাংলা
বাংলা हिन्दी
 Čeština
 Українська
 Română

