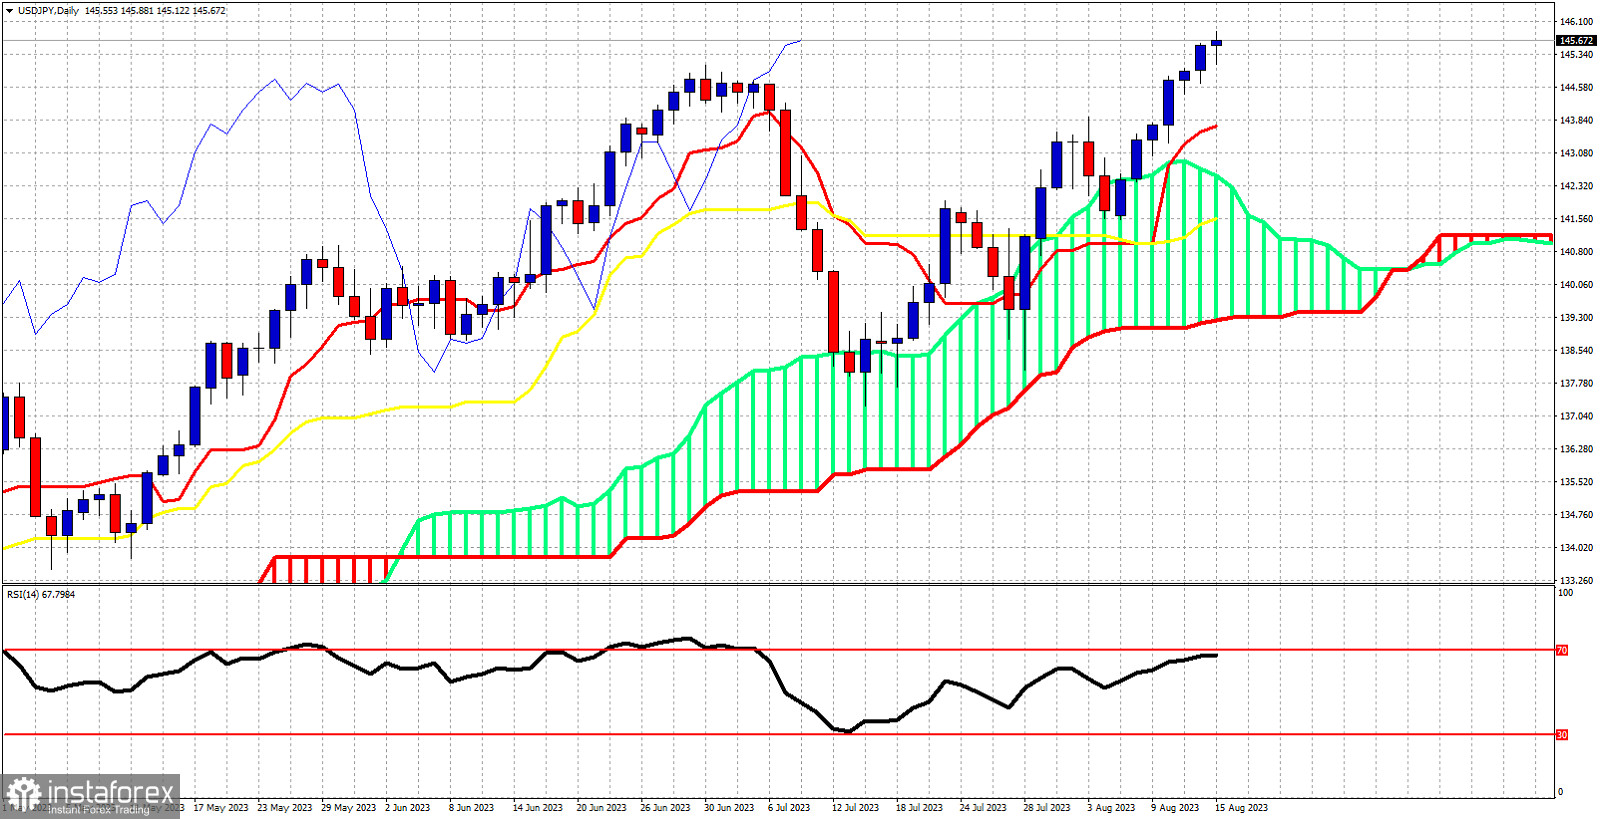
USDJPY is trading above 145. According to the Ichimoku cloud indicator trend in the Daily chart is bullish. In our last analysis on USDJPY we noted that a break above 144 will open the way for a move towards 145 and most probably new 2023 highs. The Chikou span (blue line indicator) is above the candlestick pattern (bullish). The tenkan-sen (Red line indicator) provides support at 143.70 and the kijun-sen (yellow line indicator) at 141.57. The Kumo (cloud) provides support at 142.56. The RSI is still not at overbought levels. The current picture in the Daily chart remains optimistic for higher levels in USDJPY with the occasional pull backs. So far no worries of a major reversal.
 English
 Русский
 Bahasa Indonesia
 Bahasa Malay
 ไทย
ไทย Español
 Deutsch
 Български
 Français
 Tiếng Việt
 中文
中文 বাংলা
বাংলা हिन्दी
 Čeština
 Українська
 Română

