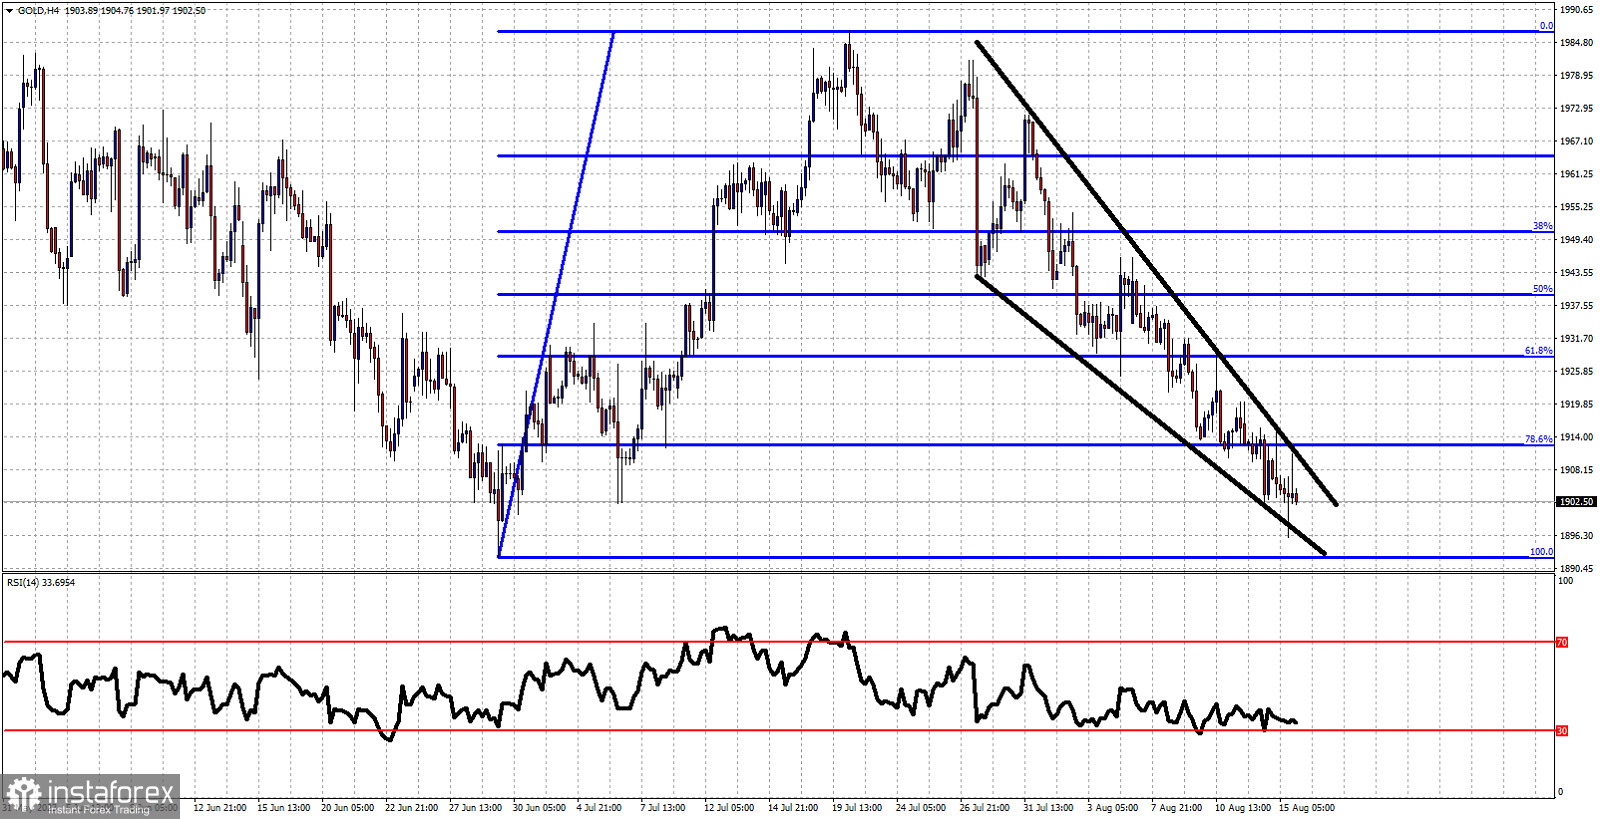
Blue lines- Fibonacci retracement levels
Black lines- downward sloping wedge pattern
Gold price is making new lower lows. Trend remains bearish as price is making lower lows and lower highs. Price has now broken below the 78.6% Fibonacci retracement support level and is heading towards the $1,892 June lows. Price remains inside the downward sloping wedge pattern. Resistance is now found at $1,912. A break above this level would be a first sign of a short-term trend reversal and the start of a bounce. Until then, bears remain in control of the trend.
 English
 Русский
 Bahasa Indonesia
 Bahasa Malay
 ไทย
ไทย Español
 Deutsch
 Български
 Français
 Tiếng Việt
 中文
中文 বাংলা
বাংলা हिन्दी
 Čeština
 Українська
 Română

