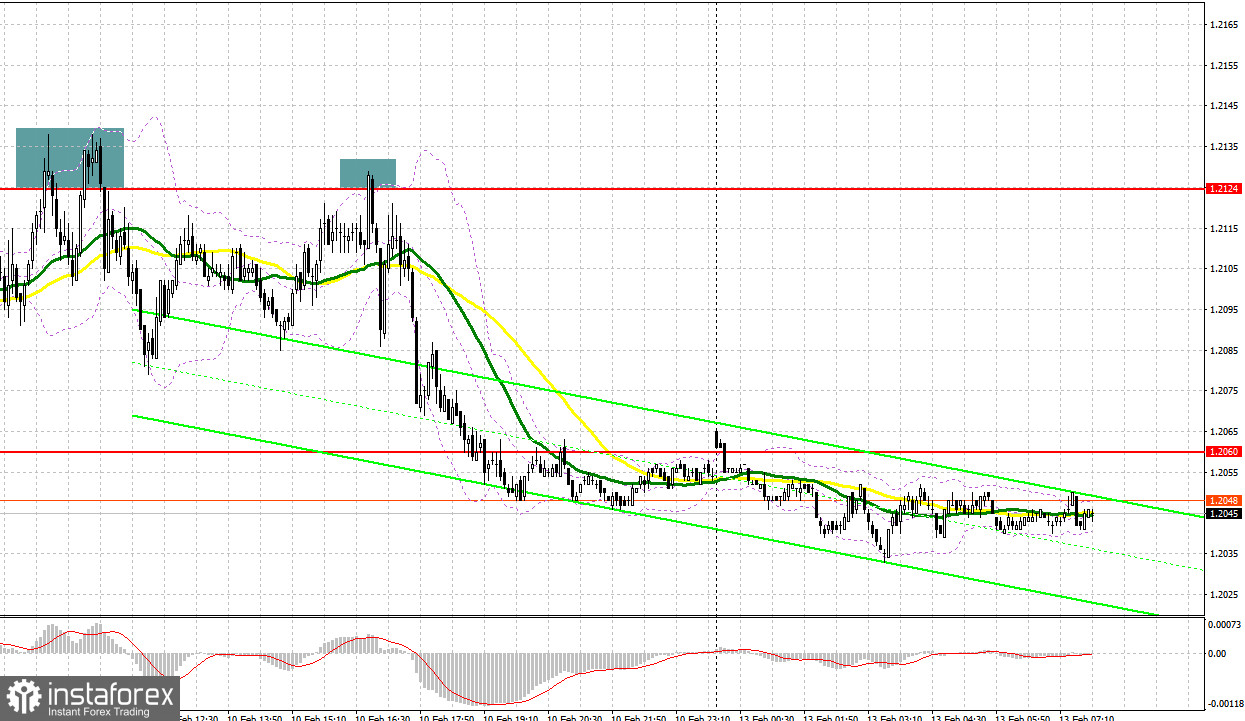
On Friday, traders received several signals to enter the market. Let us take a look at the 5-minute chart to clear up the market situation. Earlier, I asked you to pay attention to the level of 1.2124 to decide when to enter the market. A jump in the first part of the day led to a false breakout of 1.2124, which resulted in a drop of more than 40 pips. In the second part of the day, bulls tried to go above 1.2124 but failed. As a result, the pound sterling declined by more than 60 pips.

Conditions for opening long positions on GBP/USD:
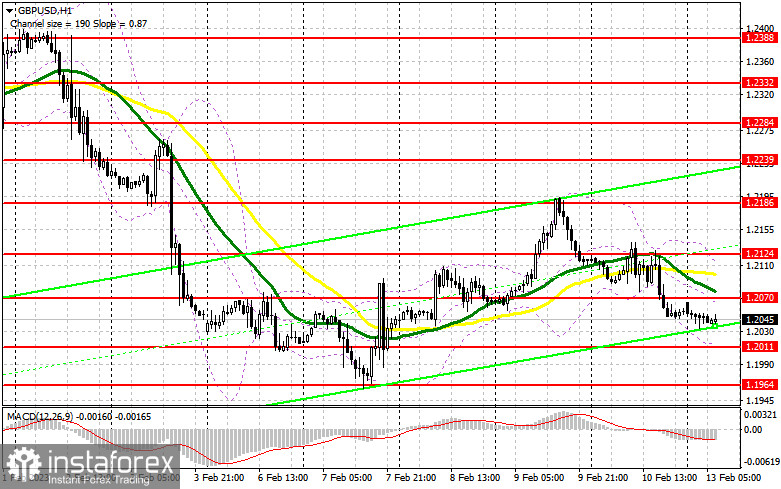
Today, the UK will not publish any macroeconomic report. Thus, the pound sterling may show an upward correction. Today, bulls should primarily protect the nearest support level of 1.2011. If they fail to do so, a bullish correction will hardly be possible. If the pair drops, buyers will become active only after a false breakout of 1.2011, a support level formed in the middle of the previous week. In the event of this, the British pound may return to 1.2070. Bulls and bears are likely to fight for this level. The pound sterling will have a chance to climb to the high of 1.2124 only in case of a settlement and a downward test of 1.2070 amid the absence of news. If the price exceeds the high of 1.2124, it may rise to 1.2186, where it is better to lock in profits. If bulls fail to protect 1.2011, pressure on the pound/dollar pair will increase significantly. In this case, traders should remain cautious and open long positions only near the next support level of 1.1964 after a false breakout. It is also possible to go long just after a bounce off 1.1881, expecting a rise of 30-35 pips.
Conditions for opening short positions on GBP/USD:
On Friday, bears were very aggressive in an attempt to stop the bullish correction. However, they had to take a pause. Now, they should primarily protect the resistance level of 1.2070. Slightly above this level, there are buyers' MAs. A rise and a false breakout of this level will lead to a sell signal with the target at 1.2011, an intermediate support level, where bulls may enter the market again. If the price fails to show a rapid rise from this level, a breakout and an upward test of 1.2011 will prevent the currency from recovering after a sell-off on Friday. In this case, bears will become stronger, thus forming a sell signal with the target at 1.1964. The farthest target is located at 1.1881. If the price hits this level, a new downward trend will be formed. At this level, traders should lock in profits. If the pound/dollar pair increases and bears fail to protect 1.2070, bulls will become stronger. In this case, only a false breakout near the next resistance level of 1.2124 will give a sell signal. If bears fail to be active at this level, it will be possible to sell the asset from the high of 1.2186, expecting a decline of 30-35 pips within the day.

COT report
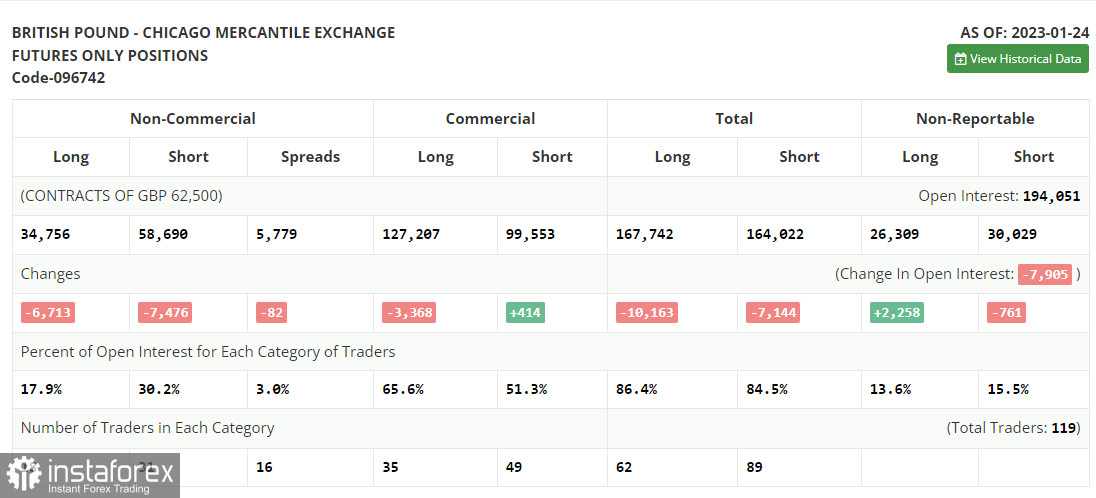
According to the COT report from January 24, the number of both long and short positions dropped. However, the current decline was quite acceptable. The fact is that the UK government is coming across tough times. It is struggling with strikes and demands to raise wages and at the same time, it is trying to achieve a steady decline in inflation. However, this is of less importance at the moment since traders are waiting for the meetings of the Fed and the BoE. The Fed is expected to switch to a less hawkish stance, whereas the BoE may remain aggressive. This may have a positive effect on the pound sterling. That is why I will bet on its further rise. The recent COT report unveiled that the number of short non-commercial positions decreased by 7,476 to 58,690, while the number of long non-commercial positions decreased by 6,713 to 34,756. As a result, the negative value of the non-commercial net position dropped to -23,934 from -24,697 a week earlier. Such minor changes will hardly affect the market situation. Thus, we will continue to closely monitor the economic indicators for the UK and the decision of the Bank of England. The weekly closing price rose to 1.2350 against 1.2290.

Signals of indicators:
Moving Averages
Trading is performed below 30- and 50-day moving averages, which points to bears' attempt to revive the downtrend.
Note: The author considers the period and prices of moving averages on the one-hour chart which differs from the general definition of the classic daily moving averages on the daily chart.
Bollinger Bands
If the pair increases, the resistance level will be formed by the upper limit of the indicator located at 1.2100. In case of a decline, the lower limit of the indicator located at 1.2010 will act as support.
Description of indicators
- Moving average (a moving average determines the current trend by smoothing volatility and noise). The period is 50. It is marked in yellow on the chart.
- Moving average (a moving average determines the current trend by smoothing volatility and noise). The period is 30. It is marked in green on the graph.
- MACD indicator (Moving Average Convergence/Divergence - convergence/divergence of moving averages). A fast EMA period is 12. A slow EMA period is 26. The SMA period is 9.
- Bollinger Bands. The period is 20.
- Non-profit speculative traders are individual traders, hedge funds, and large institutions that use the futures market for speculative purposes and meet certain requirements.
- Long non-commercial positions are the total number of long positions opened by non-commercial traders.
- Short non-commercial positions are the total number of short positions opened by non-commercial traders.
- The total non-commercial net position is a difference in the number of short and long positions opened by non-commercial traders.
 English
 Русский
 Bahasa Indonesia
 Bahasa Malay
 ไทย
ไทย Español
 Deutsch
 Български
 Français
 Tiếng Việt
 中文
中文 বাংলা
বাংলা हिन्दी
 Čeština
 Українська
 Română

