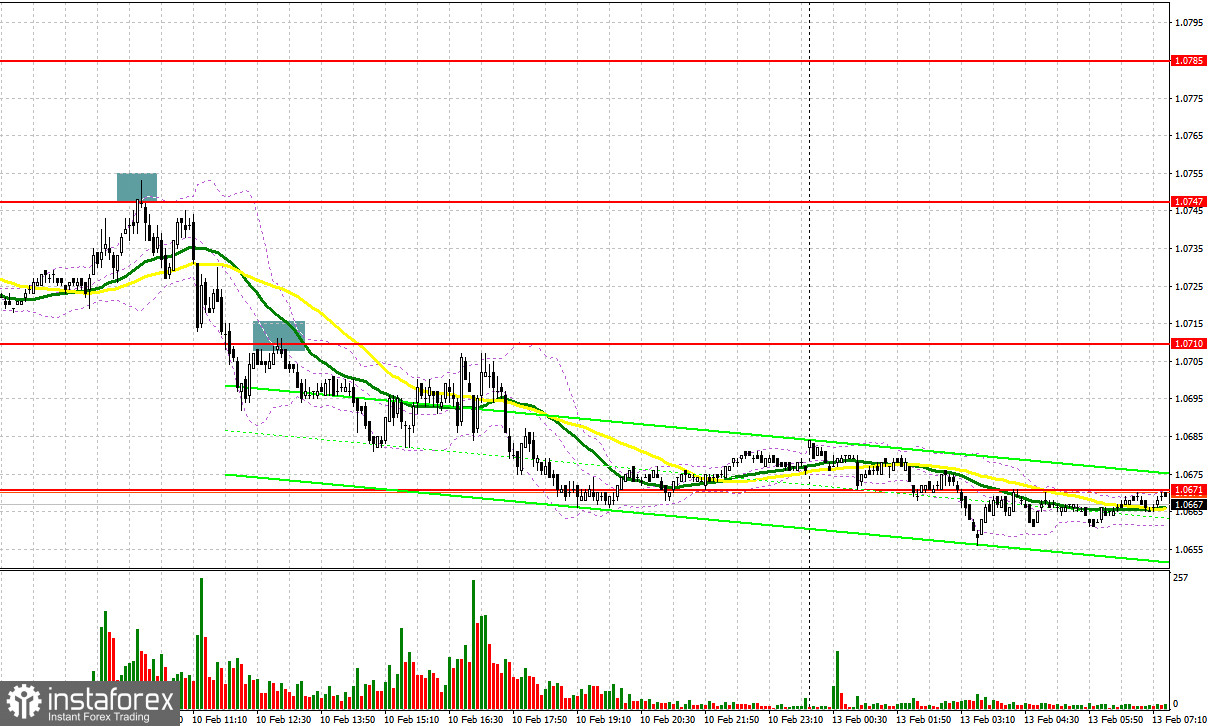
Last Friday, EUR/USD formed several nice entry signals. Let's have a look at the 5-minute chart and see what happened there. In my morning review, I mentioned the level of 1.0747 as a good point for entering the market. A surge to the upside resulted in a false breakout of 1.0747 which later sent the euro down to 1.0706. This move generated a profit of 40 pips. A breakout of 1.0706 and its upward retest gave an additional sell signal that was activated in the second half of the day. This brought us another 40 pips in profit.

For long positions on EUR/USD:
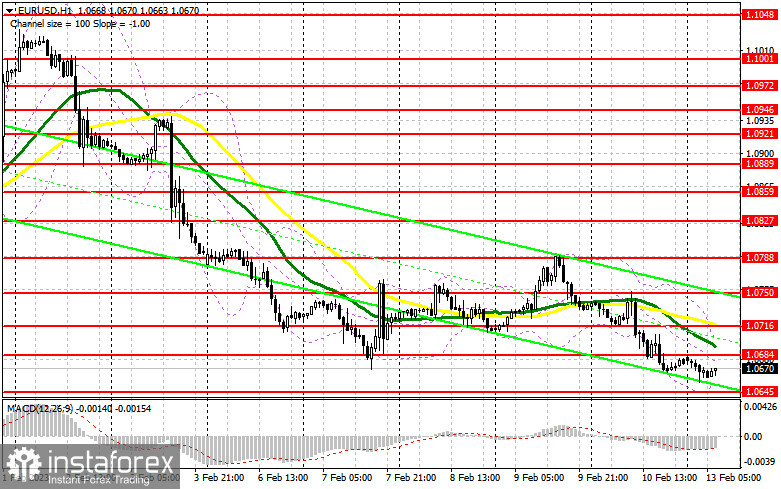
Last Friday, the euro retested the weekly low signalling an attempt to resume the bearish market that has been developing since early February. The euro is unlikely to recover quickly given that the majority of market participants bet on further monetary tightening by the Fed in the first half of 2023. In the short term, we have no data publications today that could potentially change the trajectory of the pair. Therefore, the instrument is expected to trade within a sideways channel and is likely to retest the low from the previous week. If the pair declines, you may consider buying the euro only after a false breakout at 1.0645 (new weekly low). The upward target will be the level of 1.0684 formed on Friday. A breakout and a downward retest of this range will create another entry point for going long, with a target at 1.0716 where the moving averages support the bears. A break above this level will trigger stop-loss orders and will open the way to 1.0750 where I'm going to lock in profits. However, the pair is unlikely to develop such a rapid upward movement today. If EUR/USD depreciates and bulls are idle at 1.0645 in the first half of the day, the pair will remain under pressure and the buyers will completely lose control of the market. If so, the focus will be on the next support at 1.0601. Only a false breakout of this level will give us a new signal to buy the euro. I will go long right after a rebound from the low of 1.0565 or 1.0525, with the next intraday target found within 30-35 pips.
For short positions on EUR/USD:
You can sell the pair from 1.0684, the new resistance level formed last Friday. Before going short, I would recommend that you wait for large market players to enter the market. A rise in the price or a false breakout will be enough to prove this. The lack of the fundamental background will return pressure on the euro which will serve as a sell signal with the target at the low of 1.0645. A breakout and a retest of this range will generate an additional sell signal with the next target at 1.0601. This will strengthen the bearish bias. If the price settles below this range amid the statement made by the Fed officials, the pair will extend its fall toward 1.0565. This is where I'm going to take profit. If EUR/USD advances in the European session and bears are idle at 1.0684, bulls will try to regain control of the market which may keep the pair in the sideways channel. In this case, you should go short only when the quote reaches 1.0716 and fails to settle there. I will open sell positions right after a rebound from the high of 1.0750, keeping in mind a possible downward correction of 30-35 pips.

COT report
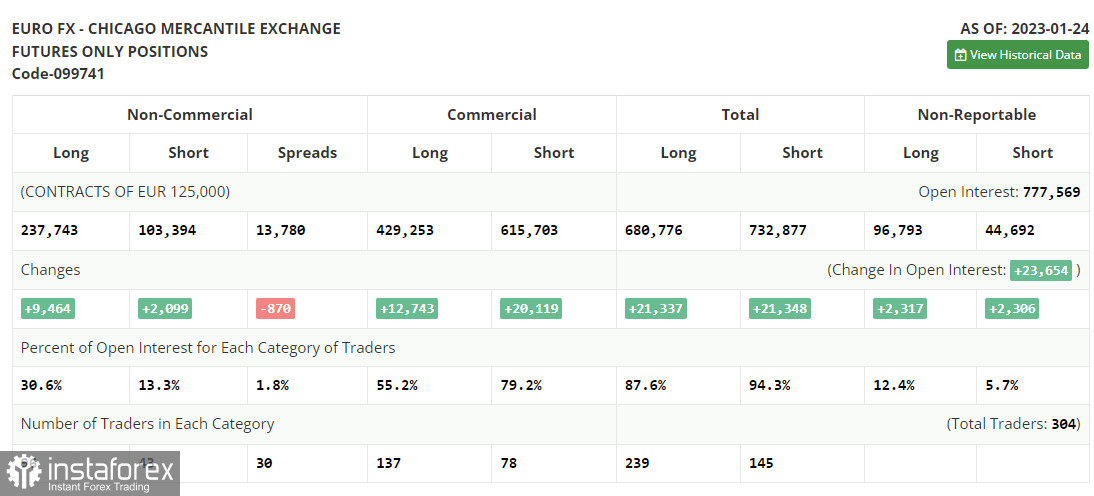
The Commitments of Traders report for January 24 recorded a rise in both long and short positions. Apparently, traders inspired by the ECB rhetoric continued to add long positions as they clearly expect the regulator to maintain its hawkish policy. At the same time, markets hope that the Fed will ease its monetary tightening and slow the pace of increase for the second time in a row. The recent weak economic data showing a decline in retail sales and a slowdown in inflation prove that the regulator might want to loosen its policy to avoid damage to the US economy. This week, central bank meetings will shape the future trajectory of the pair. According to the latest COT report, long positions of the non-commercial group of traders rose by 9,464 to 237,743, while short positions jumped by 2,099 to 103,394. The total non-commercial net-position increased to reach 134,349 versus 126,984. All this indicates that investors believe in the euro's uptrend but are still waiting for more clues regarding central bank interest rates. The weekly closing price went up to 1.0919 from 1.0833.

Indicator signals:
Moving Averages
Trading above the 30- and 50-day moving averages indicates market uncertainty.
Please note that the time period and levels of the moving averages are analyzed only for the H1 chart, which differs from the general definition of the classic daily moving averages on the D1 chart.
Bollinger Bands
If the pair advances, the upper band of the indicator at 1.0845 will serve as resistance. In case of a decline, the lower band of the indicator at 1.0800 will act as support.
Description of indicators:
• A moving average of a 50-day period determines the current trend by smoothing volatility and noise; marked in yellow on the chart;
• A moving average of a 30-day period determines the current trend by smoothing volatility and noise; marked in green on the chart;
• MACD Indicator (Moving Average Convergence/Divergence) Fast EMA with a 12-day period; Slow EMA with a 26-day period. SMA with a 9-day period;
• Bollinger Bands: 20-day period;
• Non-commercial traders are speculators such as individual traders, hedge funds, and large institutions who use the futures market for speculative purposes and meet certain requirements;
• Long non-commercial positions represent the total number of long positions opened by non-commercial traders;
• Short non-commercial positions represent the total number of short positions opened by non-commercial traders;
• The non-commercial net position is the difference between short and long positions of non-commercial traders.
 English
 Русский
 Bahasa Indonesia
 Bahasa Malay
 ไทย
ไทย Español
 Deutsch
 Български
 Français
 Tiếng Việt
 中文
中文 বাংলা
বাংলা हिन्दी
 Čeština
 Українська
 Română

