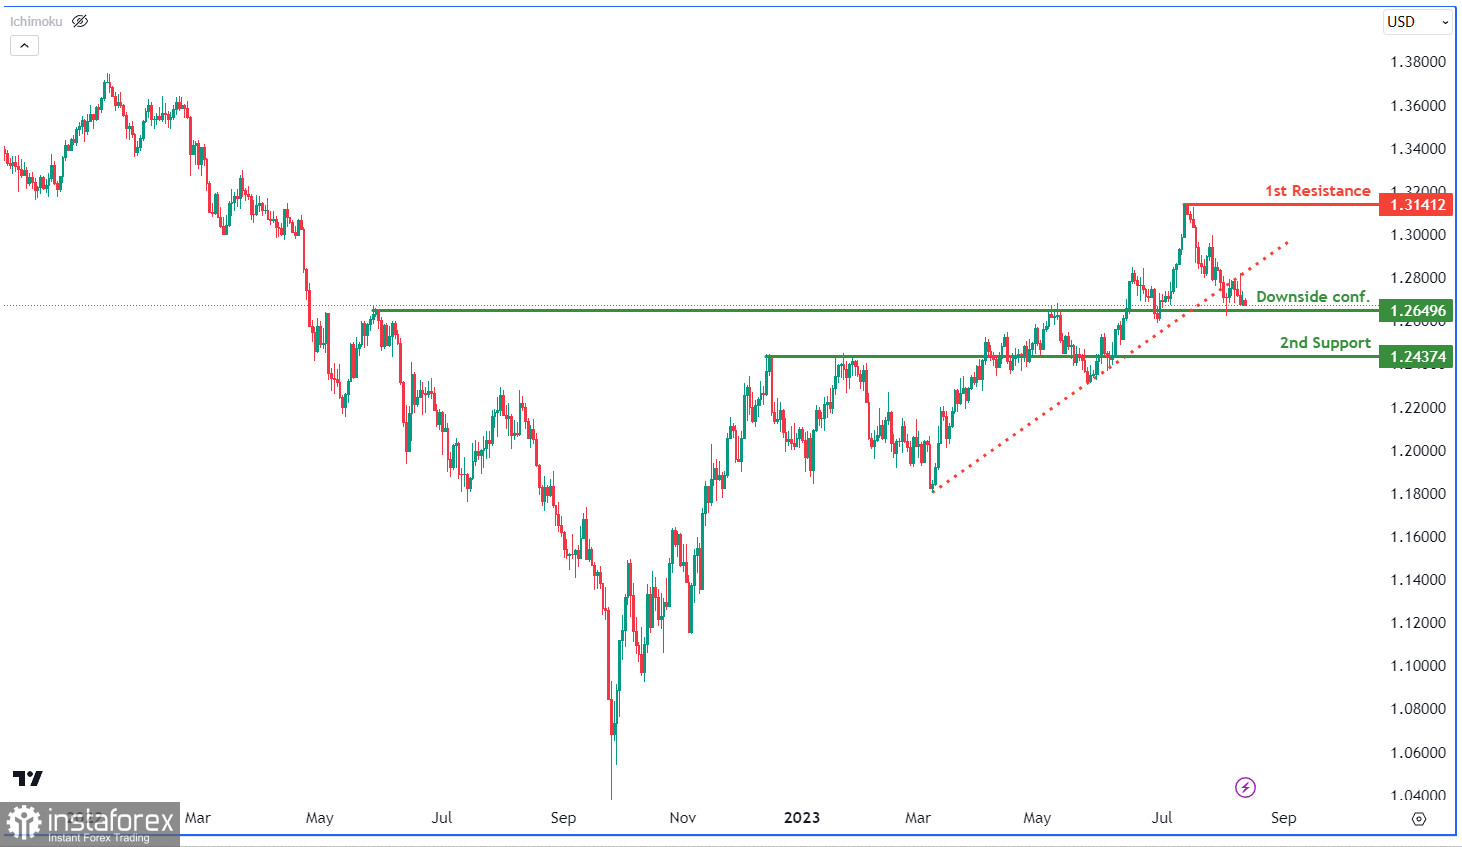
The GBP/USD chart currently shows a downward trend, confirmed by the price breaking below an upward support line. Despite this bearish movement, there's a chance the price could briefly rise to the initial resistance of 1.3141 before resuming its downward path. The first support at 1.2649 holds significance as an overlap support, and the second support at 1.2437 adds to the support structure. On the flip side, the first resistance at 1.3141 is notable as a swing high resistance, while a secondary resistance at 1.2815 is identified as an overlap resistance, potentially influencing future price changes.
 English
 Русский
 Bahasa Indonesia
 Bahasa Malay
 ไทย
ไทย Español
 Deutsch
 Български
 Français
 Tiếng Việt
 中文
中文 বাংলা
বাংলা हिन्दी
 Čeština
 Українська
 Română

