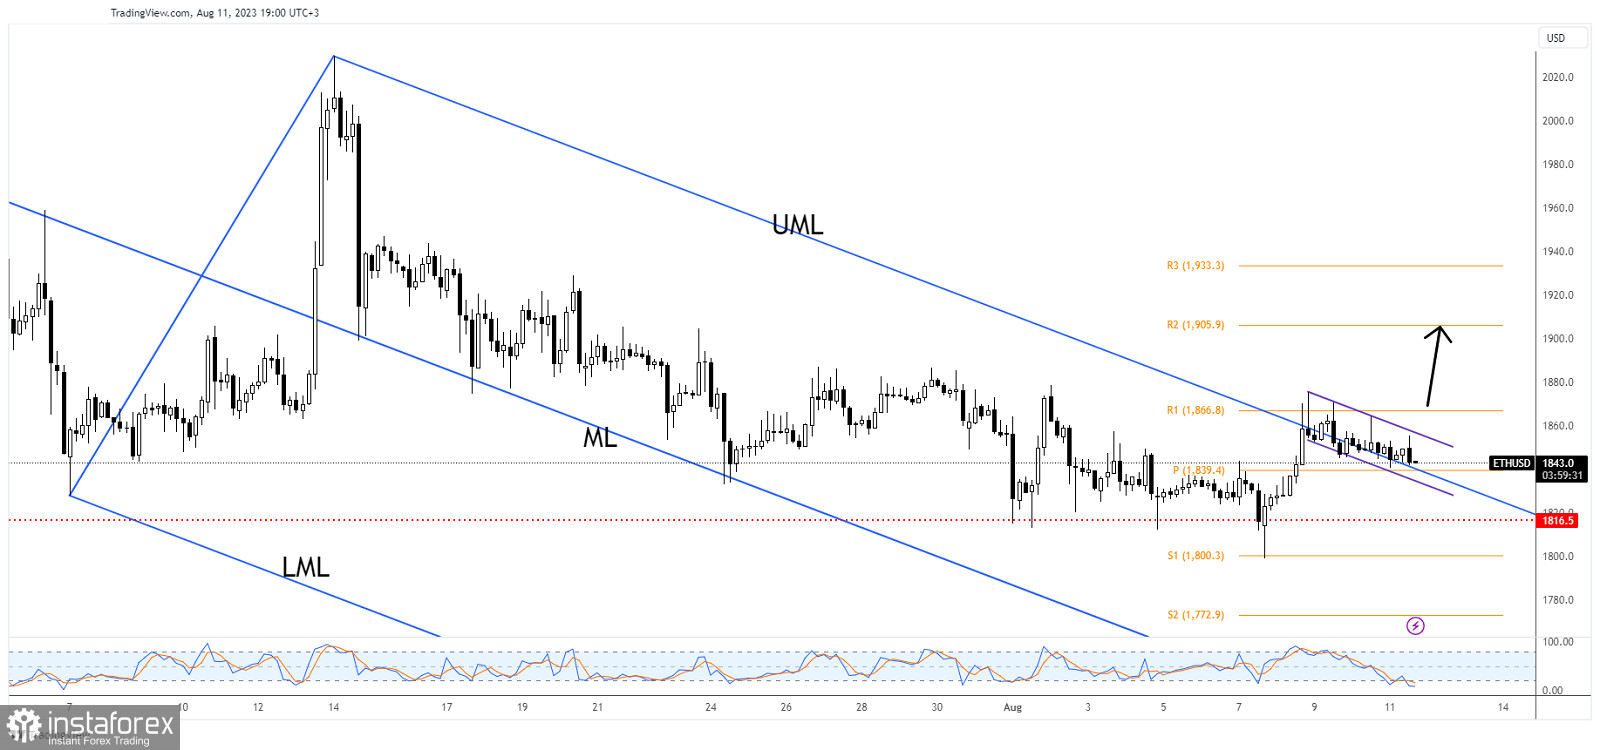
Ethereum dropped a little and now is trading at 1,844. Still, the retreat could be only temporary after its last rally. It has dropped by 1.85% from Tuesday's high of 1,875 to 1,840 today's low.
Bitcoin's retreat forced the altcoin to come back down as well. In the last 24 hours, ETH/USD is down by 0.30% and it's up by 0.05% in the last 7 days.
ETH/USD Retests The Buyers!

ETH/USD found resistance right above the weekly R1 of 1,866 and now it has dropped trying to confirm the breakout through the upper median line (UML).
In the short term, it has developed a flag pattern which could represent a bullish formation as long as the price stays above the weekly pivot point of 1,839 and above the UML.
ETH/USD Forecast!
Jumping and closing above the flag's resistance and above R1 (1,866) announces a larger growth.
 English
 Русский
 Bahasa Indonesia
 Bahasa Malay
 ไทย
ไทย Español
 Deutsch
 Български
 Français
 Tiếng Việt
 中文
中文 বাংলা
বাংলা हिन्दी
 Čeština
 Українська
 Română

