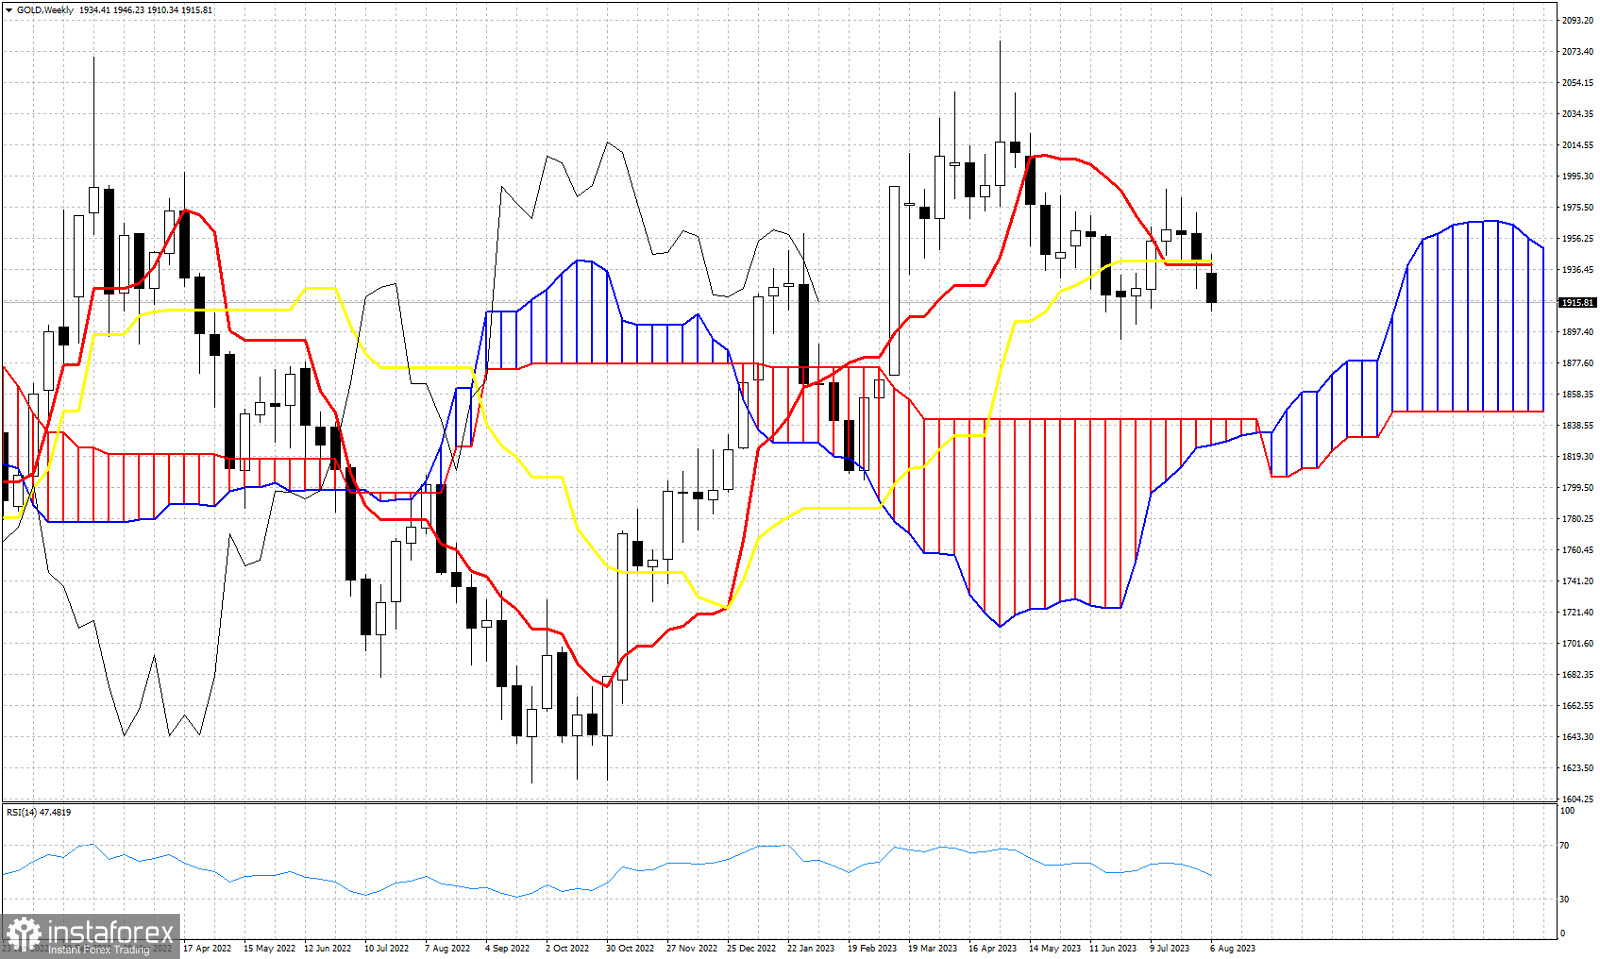
The weekly candlestick in Gold is providing a bearish warning. Price this week is trading below the tenkan-sen (red line indicator) and the kijun-sen (yellow line indicator). Both these two indicators provide resistance at $1,940. A weekly close below this level suggests that price remains vulnerable to a move towards the weekly Kumo (cloud) at $1,842. The Chikou span (black line indicator) remains above the candlestick pattern (bullish), but has a negative slope making lower lows and lower highs. Although price remains above the Kumo (bullish), having broken below the kijun-sen suggests that price is vulnerable. The tenkan-sen has also crossed below the kijun-sen providing an added sign of weakness. The weekly chart using the Ichimoku cloud indicator suggests that Gold price has more chances of falling than starting a new up trend.
 English
 Русский
 Bahasa Indonesia
 Bahasa Malay
 ไทย
ไทย Español
 Deutsch
 Български
 Français
 Tiếng Việt
 中文
中文 বাংলা
বাংলা हिन्दी
 Čeština
 Українська
 Română

