EUR/USD

Higher time frames
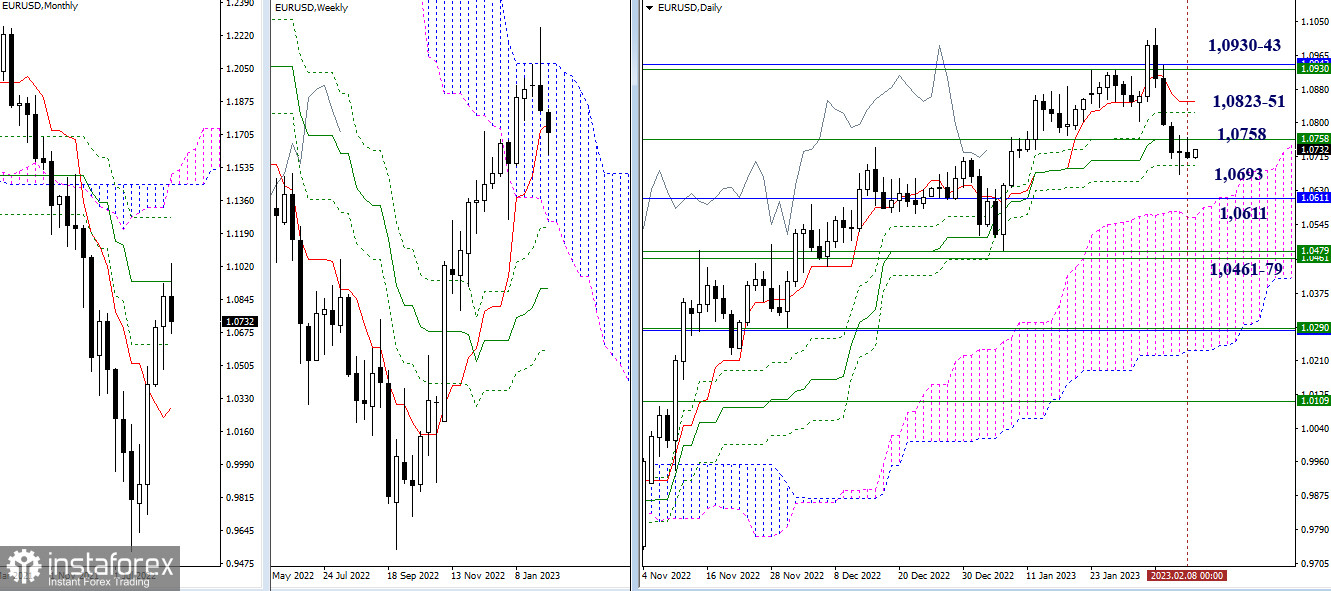
The price traded sideways after a downtrend. The previous targets are still intact. Upward targets are seen at the 1.0758 resistance level (intraday short-term trend line + weekly short-term trend line) – 1.0823-51 (daily cross levels) – 1.0930-43 (upper limit of a weekly cloud and a medium-term trend). Downward targets stand at 1.0693 (level of a daily Ichimoku cross) – 1.0611 (monthly level) – 1.0565 (upper limit of a daily cloud).

H4 – H1
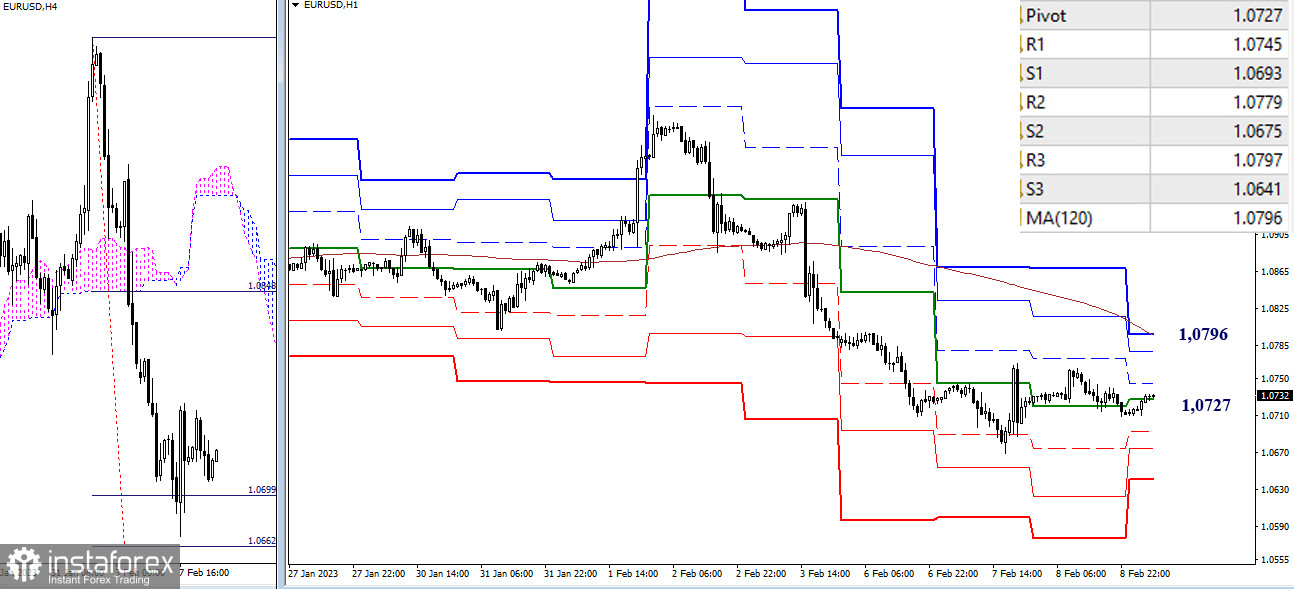
In lower time frames, the quote trades under the influence of the central pivot level of 1.0727. Key upward targets are at 1.0796 (weekly long-term trend line) and the 1.0745 – 1.0779 resistance range (classic pivot levels). Downward targets stand at 1.0693 – 1.0675 – 1.0641 (classic pivot levels) and 1.0662 (100% priced target in the H4 time frame).
***
GBP/USD

Higher time frames
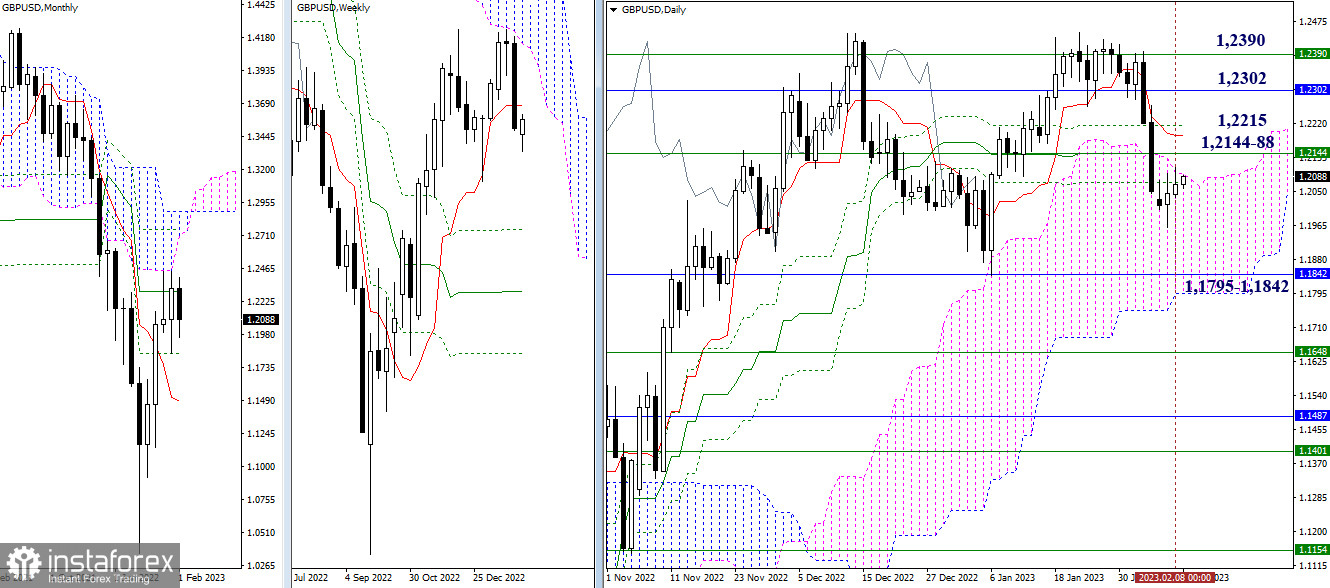
The pair is still moving in the daily cloud. Key intraday levels are 1.2072 and 1.2092. Other targets remain intact. Upward targets are important levels in different time frames: 1.2144 – 1.2188 – 1.2215 – 1.2302 – 1.2390. The nearest support zone is seen in the 1.1795 – 1.1842 range (monthly level + lower limit of the daily cloud).

H4 – H1
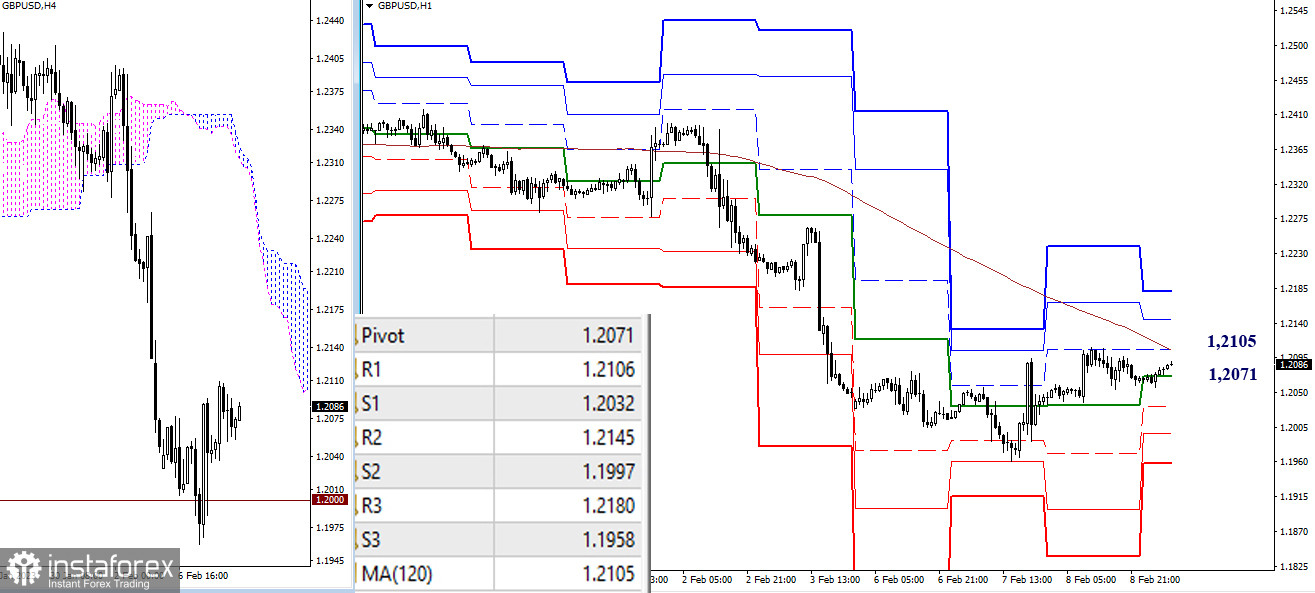
The pair is still moving in the retracement zone, with the daily central pivot level at 1.2071. The bulls should break through the resistance level of the weekly long-term trend (1.2105) and reverse the moving average. That would shift the trading balance and create new targets. Other upward targets are at 1.2145 – 1.2180 (classic pivot levels). Downward intraday targets are classic pivot support (1.2032 – 1.1997 – 1.1958), the 1.1960 low, and the 1.2000 psychological level.
***
Indicators used in technical analysis:
Higher time frames - Ichimoku Kinko Hyo (9.26.52) + Fibo Kijun levels
H1 – classic pivot points + 120-period Moving Average (weekly long-term trendline)
 English
 Русский
 Bahasa Indonesia
 Bahasa Malay
 ไทย
ไทย Español
 Deutsch
 Български
 Français
 Tiếng Việt
 中文
中文 বাংলা
বাংলা हिन्दी
 Čeština
 Українська
 Română

