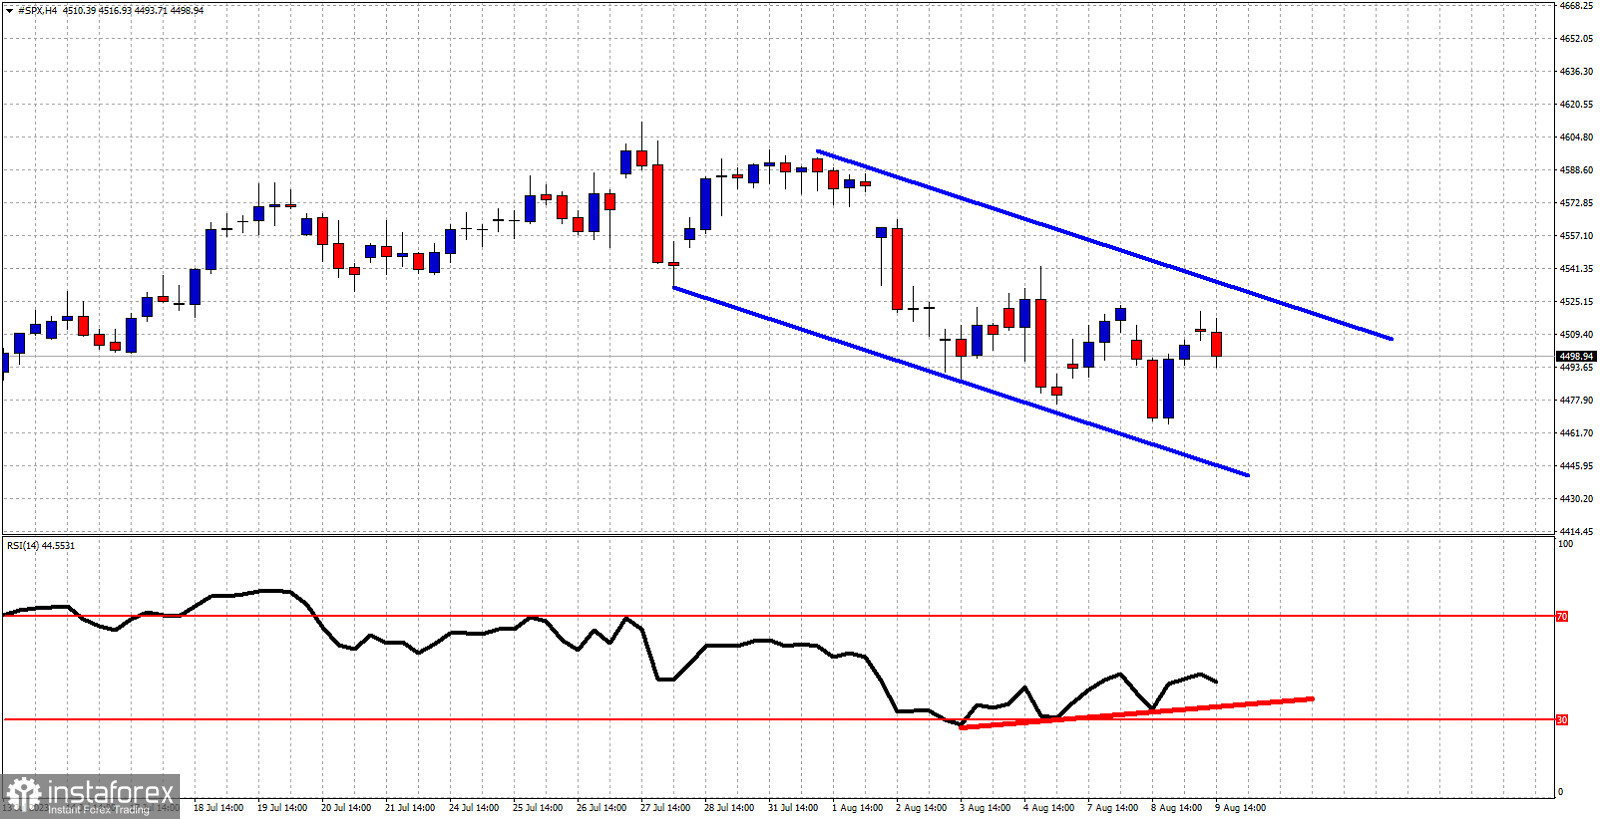
Blue lines- bearish channel
Red line- bullish RSI divergence
SPX is under pressure today after a three day bounce from 4,466 to 4520. In the near term SPX is inside the blue downward sloping channel we see in the 4 hour chart. Price continues making lower lows and lower highs. Channel resistance is found at 4,530. As long as price is below this level, bears will remain in control of the near term trend and will push price lower towards 4,400. However the RSI is providing us with bullish divergence signs. Of course this is not enough for a trend change. This is only a warning. Not a reversal sign. If bulls manage to break above yesterday's highs they will be one step closer to breaking out of the short-term bearish channel.
 English
 Русский
 Bahasa Indonesia
 Bahasa Malay
 ไทย
ไทย Español
 Deutsch
 Български
 Français
 Tiếng Việt
 中文
中文 বাংলা
বাংলা हिन्दी
 Čeština
 Українська
 Română

