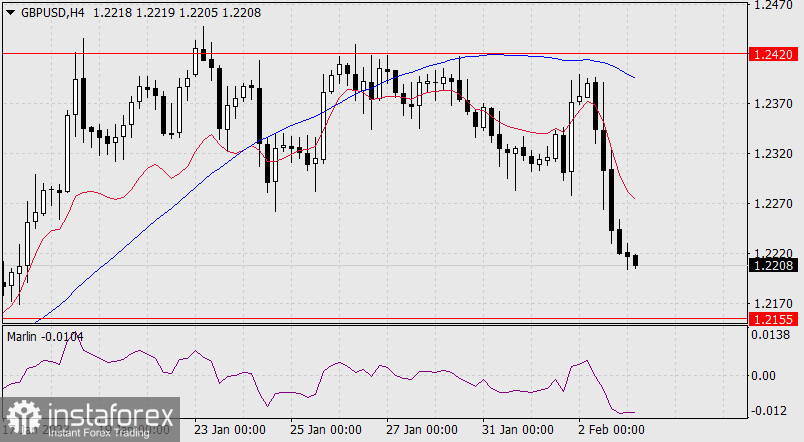
As a result of yesterday's Bank of England meeting, which raised the rate by 0.50% and made it clear that it wouldn't go for a much higher rate in the future (and investors are waiting for the end of the rate hike cycle in the spring), the pound collapsed by one and a half figures.

This fall was just enough for the price to overcome the support of the MACD indicator line on the daily chart and to cross the limit of the area of the downtrend for the Marlin oscillator. The pair is on a downtrend on the daily chart. The nearest target is 1.2155. If we receive good US employment data today, GBP can reach the target. Settling below the level will open the target of 1.1933 (June 2022 low).

Crossing 1.2155 has another important factor - it will mean crossing the support of the MACD indicator line on the weekly chart. And this is already the groundwork for the long-term downward movement. Also there is a price divergence with the oscillator.

It's a downtrend on the four-hour chart, only the signal line of the Marlin oscillator edges up in order to have time to get rid of it before the US session opens and continue the decline. The MACD line turned down, showing the direction of the medium-term trend.
 English
 Русский
 Bahasa Indonesia
 Bahasa Malay
 ไทย
ไทย Español
 Deutsch
 Български
 Français
 Tiếng Việt
 中文
中文 বাংলা
বাংলা हिन्दी
 Čeština
 Українська
 Română

