EUR/USD

Higher time frames
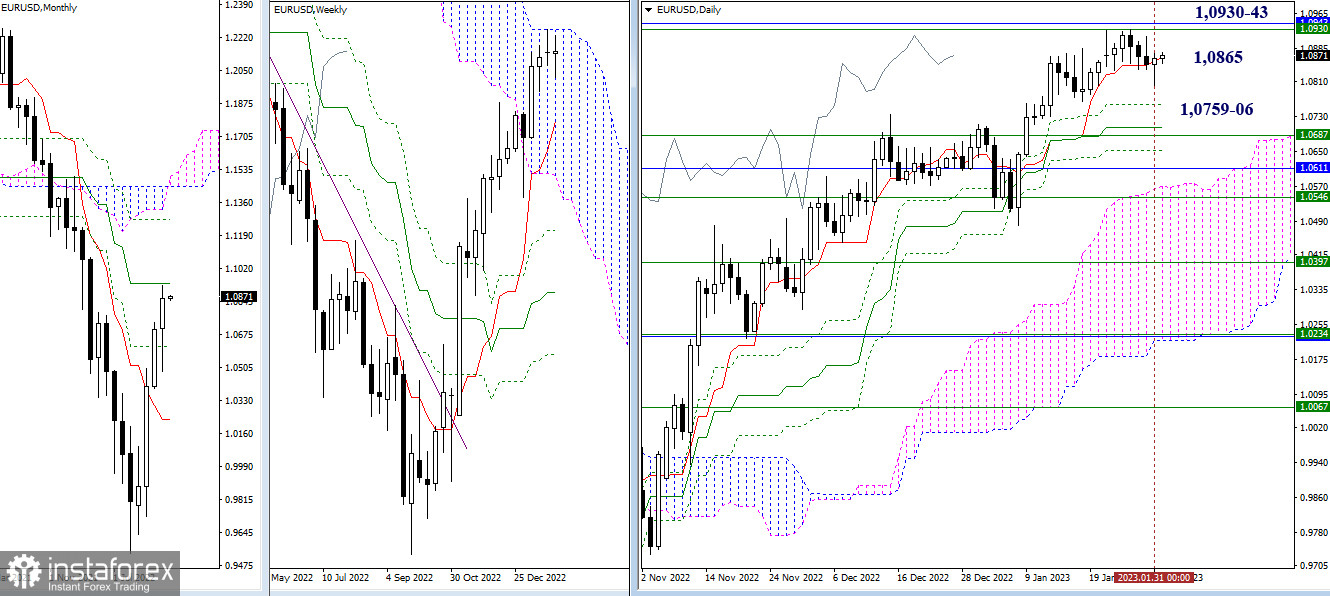
Bears were quickly exhausted yesterday. By the end of the day, the pair returned to the resistance zone of the daily short-term trend at 1.0865. Notably, the pair closed last month with a bullish candlestick which does not have any importance. In January, EUR/USD tested the resistance of the monthly medium-term trend at 1.0943 which coincides with the upper boundary of the weekly Ichimoku Cloud at 1.0930. Yet, the price failed to rebound or break through this range. Probably in February, the movements of the pair will be more pronounced. Key targets for today remain the same. The resistance area is found at 1.0943-30, while the support zone is located at 1.0759 – 1.0706 – 1.0687 (daily cross + weekly short-term trend). The level of the daily short-term trend at 1.0865 serves as the main target today.

H4 – H1
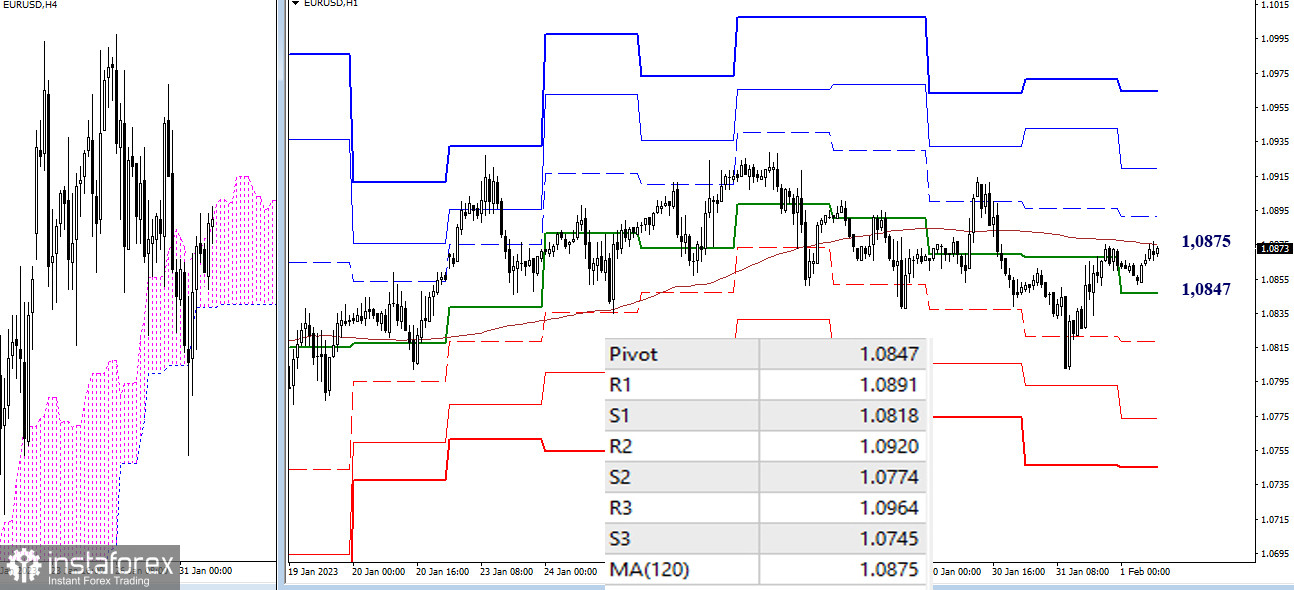
On lower time frames, bearish activity was low and not productive. The pair returned to the key resistance zone of the weekly long-term trend at 1.0875. Gaining control of this range ensures the prevalence on lower time frames. Trading near this level indicates market uncertainty. If bulls develop any activity today, their main intraday targets will be 1.0891 – 1.0920 – 1.0964 (resistance of standard pivot levels). Bears will be working towards the support of standard pivot levels at 1.0847 – 1.0818 – 1.0774 – 1.0745.
***
GBP/USD

Higher time frames
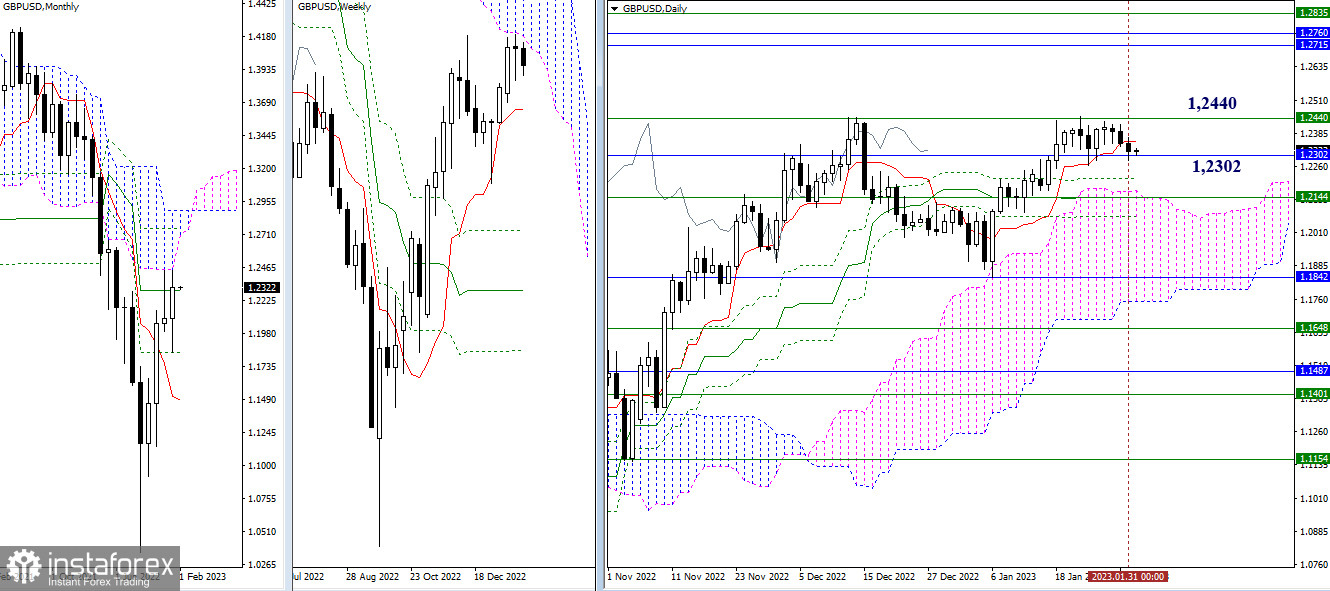
The pound/dollar pair closed last month without any significant changes. The price is still holding in the previous channel between 1.2302 (monthly medium-term trend) and 1.2440 (lower boundary of the weekly Ichimoku Cloud). Exiting this price range will allow the pair to choose a new direction. The nearest support zone is located at 1.2215 – 1.2144 – 1.2072 (daily cross + daily cloud + weekly short-term trend). The resistance area is formed by 1.2715 – 1.2760 – 1.2835 (boundaries of monthly and weekly clouds + monthly Fibo Kijun level).

H4 – H1
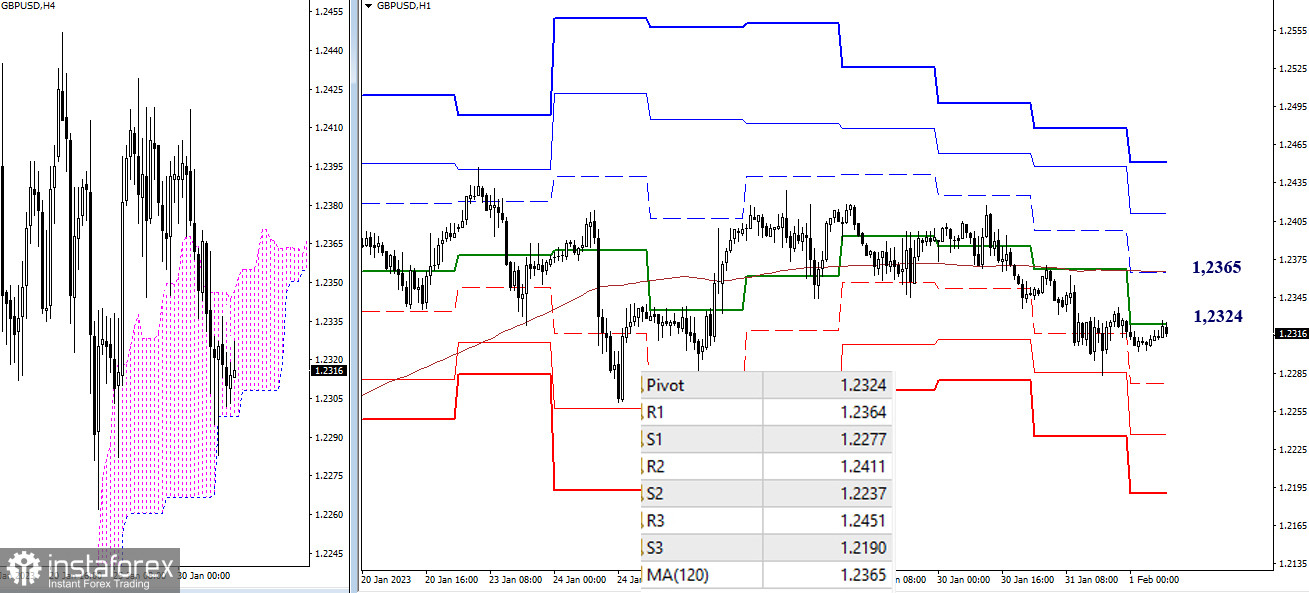
Currently, bears are in control of the market on lower time frames. A retest of yesterday's low of 1.2283 will allow the sellers to push the price lower to the support of standard pivot levels at 1.2277 – 1.2237 – 1.2190. If the pair develops an upside correction instead, the buyers will need to gain control of the key levels of 1.2324 – 1.2365 (central pivot level + weekly long-term trend) to take the lead in the market. Their next upward targets are seen at 1.2411 and 1.2451 (resistance of pivot levels).
***
Technical analysis is based on:
Higher time frames – Ichimoku Kinko Hyo (9.26.52) + Fibo Kijun levels
Lower time frames – H1: Pivot Points (standard) + 120-day Moving Average (weekly long-term trend)
 English
 Русский
 Bahasa Indonesia
 Bahasa Malay
 ไทย
ไทย Español
 Deutsch
 Български
 Français
 Tiếng Việt
 中文
中文 বাংলা
বাংলা हिन्दी
 Čeština
 Українська
 Română

