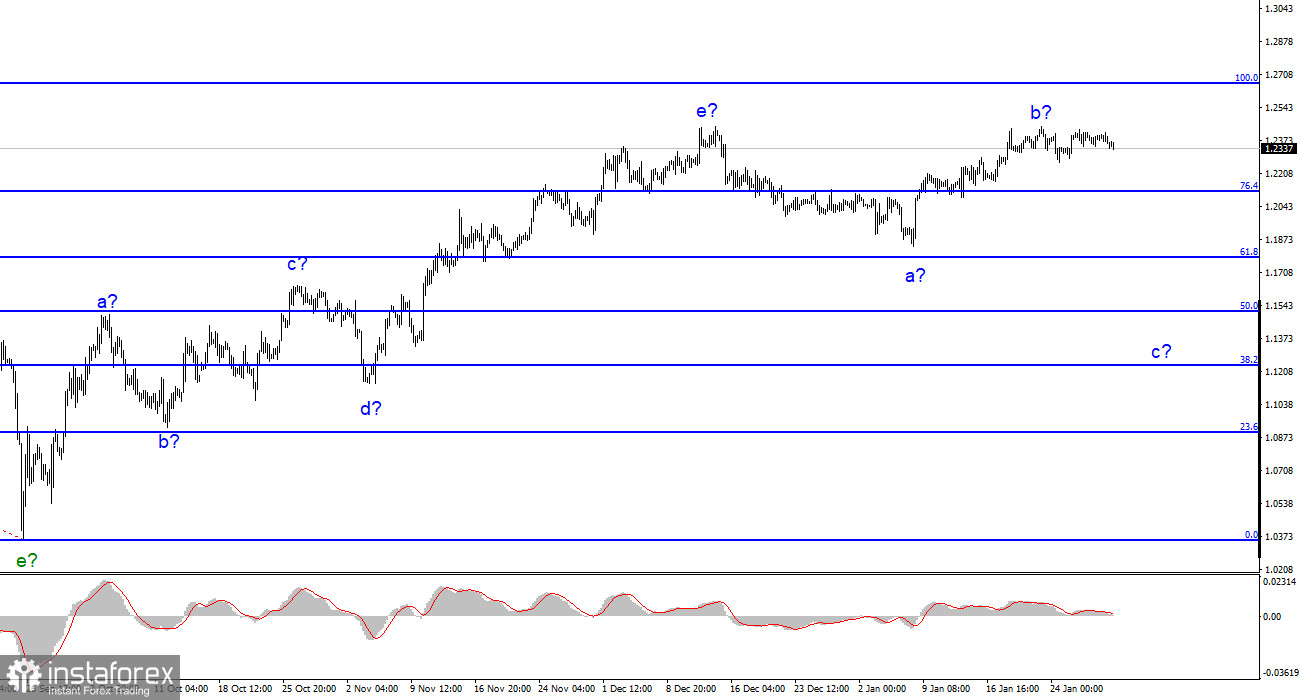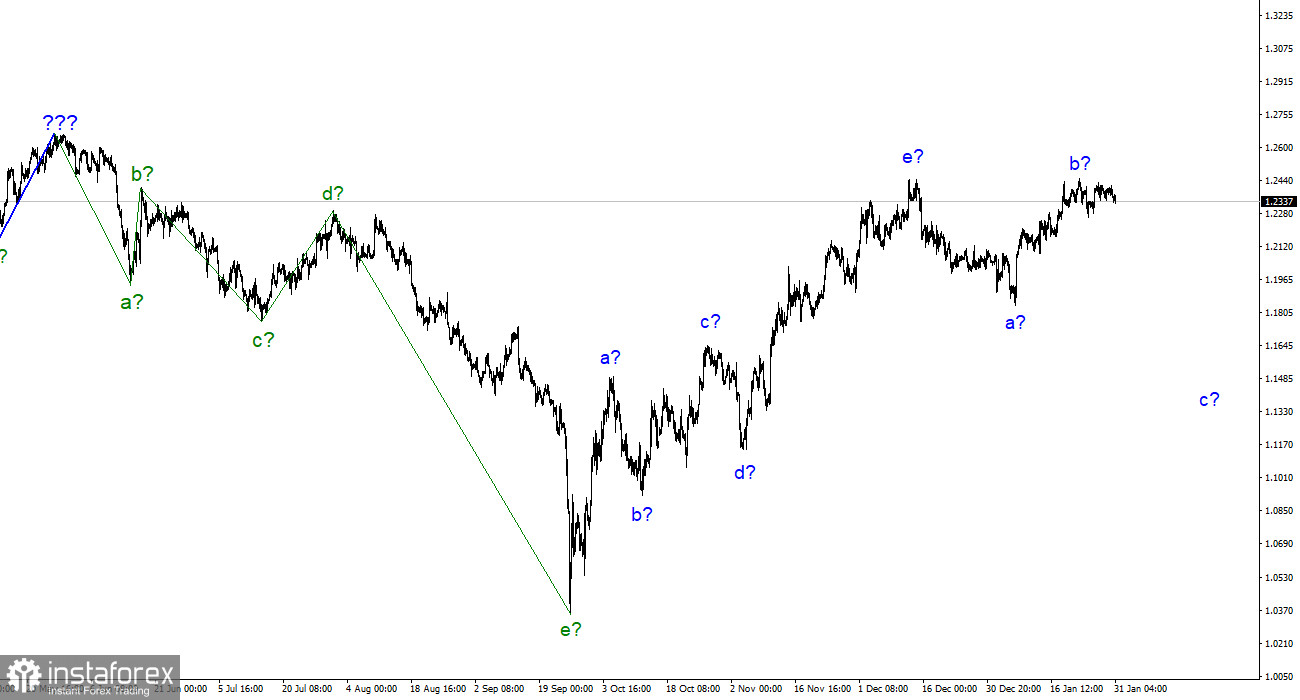
The wave structure of the pound/dollar pair is quite complicated at the moment. It slightly differs from the wave structure of the euro/dollar pair. A 5-wave upward section, which is presented as a-b-c-d-e, seems to be finished. I suppose that a downward section has started its formation. It contains at least three waves, but wave b is too long and could disappear soon. If the quote continues to rise, wave b could hardly be called an upward one, whereas the whole wave structure will need revision. Nevertheless, I still expect the formation of wave c. If the current wave structure is correct, the trading instrument may drop by 500-600 pips to 1.1508, which corresponds to the 50.0% Fibonacci level. A peak of wave b is not exceeding a peak of wave c at the moment. Thus, the current wave structure looks complete. Wave c could be formed because of the pair's drop from the recent highs.
GBP is in a risk zone. This week, it may avoid falling
On Tuesday, the pound/dollar pair declined by 30 pips. However, the general movement remained flat. Very soon, traders will receive a bulk of important information. Tomorrow, the BoE will finish its meeting, which may lead to any results. Later today, the Fed will also announce its rate decision. The fact is that Jerome Powell may change his rhetoric. Traders understood long ago that the Fed is approaching the moment when it will stop the monetary policy tightening. Thus, if the Fed Chair announces that in March, the key rate hike will stop, this will hardly shock the market. In recent months, the US dollar has dropped. Notably, a more dovish approach of the Fed may spur a deeper decline in the currency. That is why I think that any result of the FOMC meeting will allow the pound sterling to finish the upward section of the trend and correctional wave b. In this light, the asset will continue falling. However, the BoE's decision may also affect the situation. The UK inflation remains high. That is why the regulator may remain stuck to its hawkish stance. The US manufacturing PMI from ISM may continue to slide. In the event of this, demand for the greenback is unlikely to mount. In other words, the news flow continues to contradict the wave analysis.
Conclusion
According to the wave analysis of the pound/dollar pair, we may see a formation of a new downward section of the trend. Under the current conditions, traders may sell the asset with the targets located around 1.1508, the 50.0% Fibonacci level. A stop-loss order could be placed above the peaks of waves e and b. The upward section of the trend could become longer, but it seems to be finished. Sellers should be cautious since the pound sterling has every chance to jump.
On the bigger time frame, the wave structure is almost the same as of the euro/dollar pair. However, there are some obvious differences. By the moment, the pair has formed the upward correctional section of the trend. If it is true, the downward section will add at least 3 waves, thus allowing the price to fall to figure 15.
 English
 Русский
 Bahasa Indonesia
 Bahasa Malay
 ไทย
ไทย Español
 Deutsch
 Български
 Français
 Tiếng Việt
 中文
中文 বাংলা
বাংলা हिन्दी
 Čeština
 Українська
 Română


