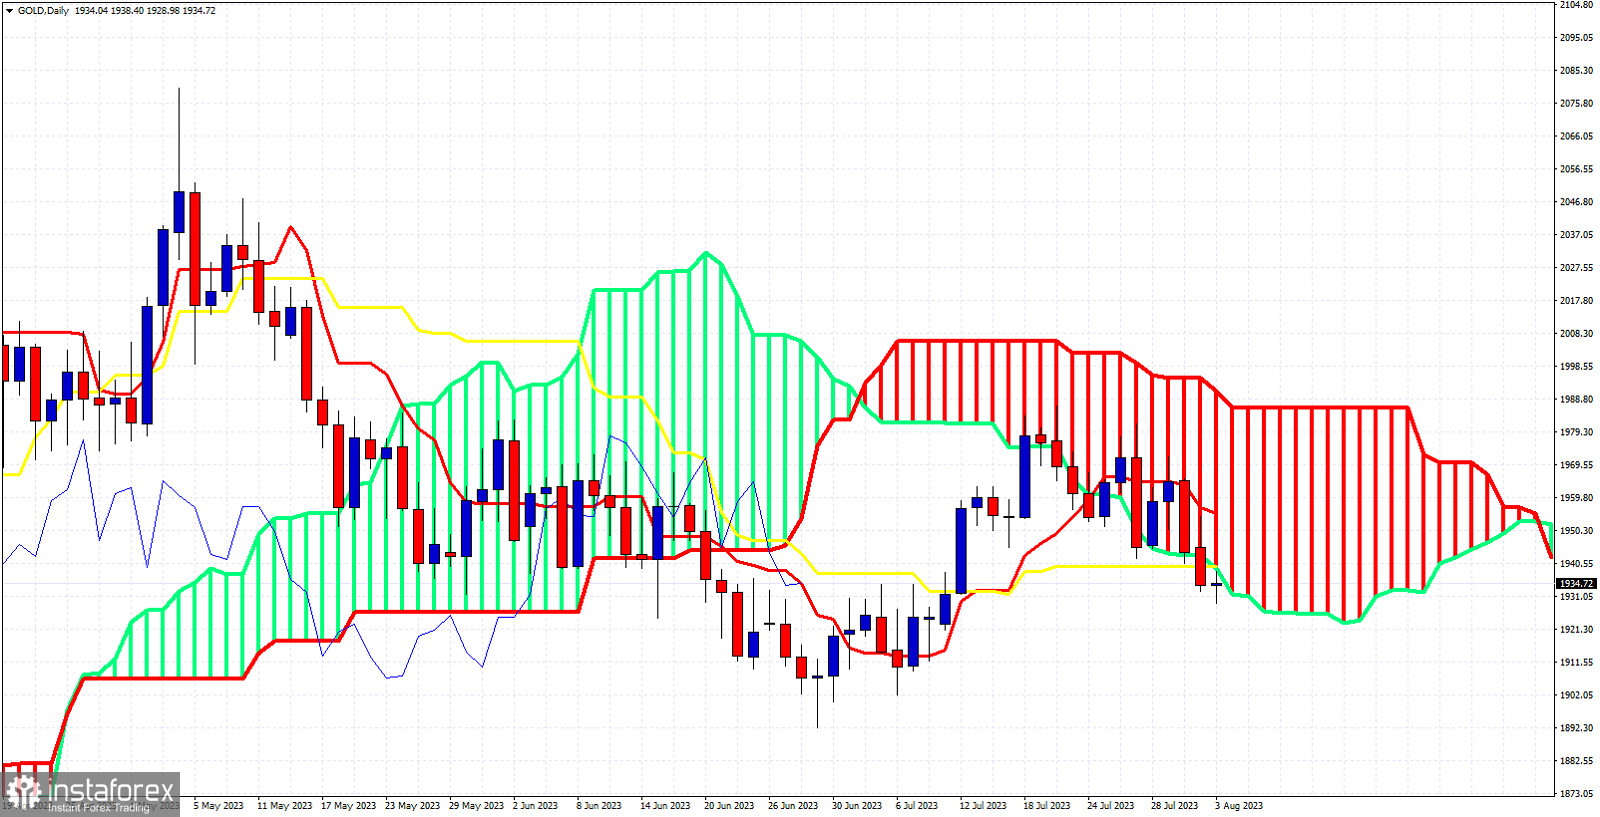
Gold price is trading around $1,935. In Ichimoku cloud terms in the Daily chart trend is bearish as price is below the Kumo (cloud). Yesterday price closed below the kijun-sen (yellow line indicator) suggesting more downside should be expected. At $1,940 we find both the kijun-sen and the lower cloud boundary. This is important daily resistance. A daily close above this level will open the way for a bounce higher towards the tenkan-sen (Red line indicator) that is short-term resistance at $1,955. The Chikou span (blue line indicator) is above the candlestick pattern (bullish) and remains bullish as long as price is above $1,913. Currently price is sliding right on top of the lower cloud boundary. If it continues to follow the path of the lower cloud boundary, we should then see a bottom and upward reversal around $1,922. Trend changes to bullish on a break above $1,986.
 English
 Русский
 Bahasa Indonesia
 Bahasa Malay
 ไทย
ไทย Español
 Deutsch
 Български
 Français
 Tiếng Việt
 中文
中文 বাংলা
বাংলা हिन्दी
 Čeština
 Українська
 Română

