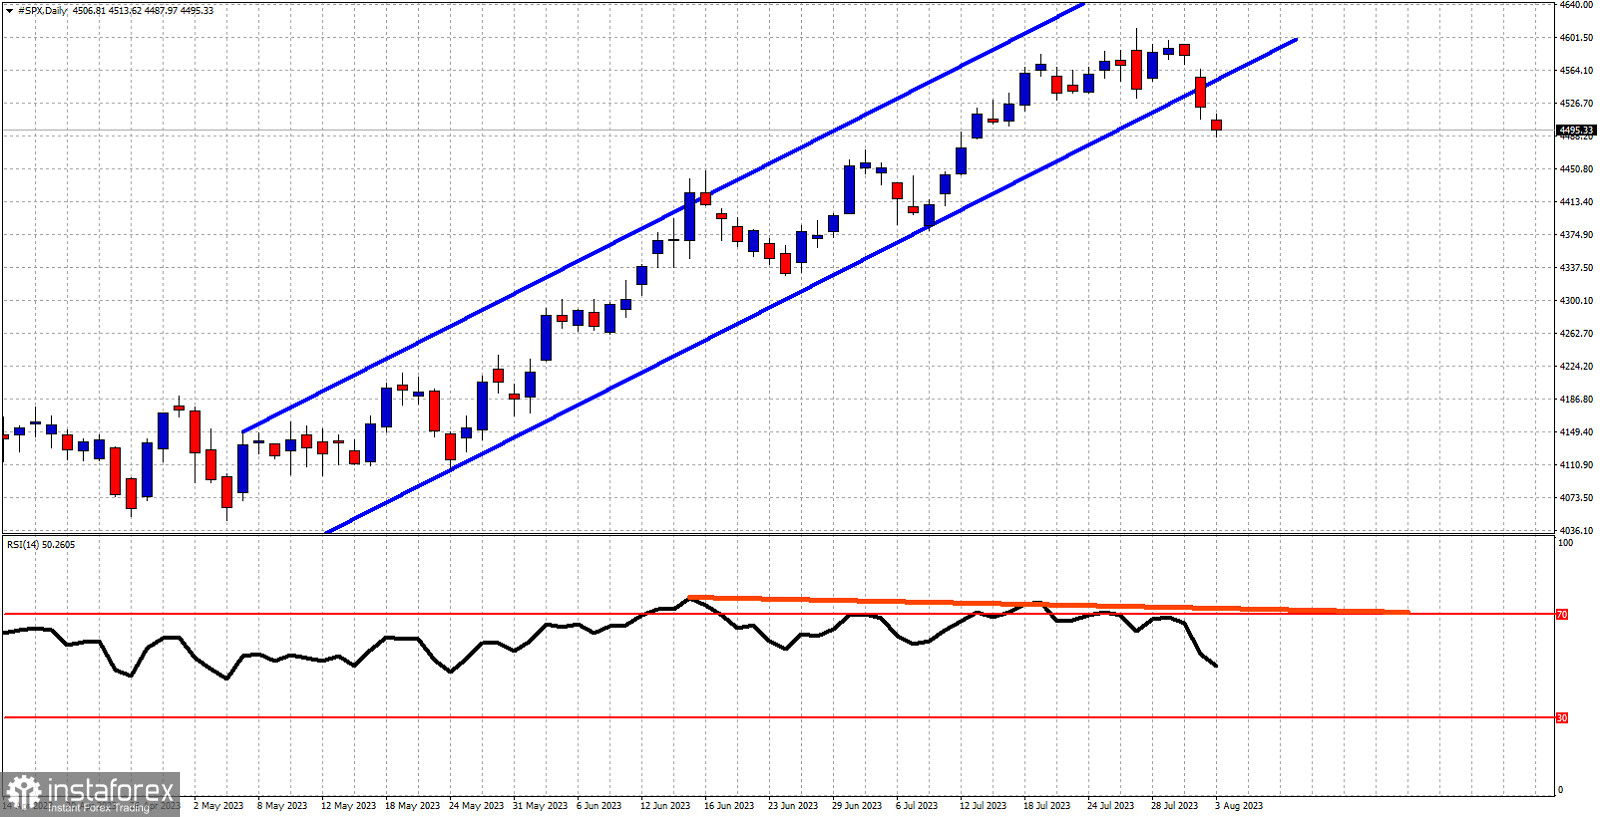
Blue lines- bullish channel (broken)
Red line -bearish RSI divergence
SPX is under pressure for a third day in a row. In previous posts we warned traders that a reversal was very possible. The bearish RSI divergence has warned us that the up trend was weakening. Yesterday we saw price break out of the bullish channel providing a bearish reversal signal. SPX is now in a corrective phase and with the RSI turning to new lower lows, we expect to see a pull back in the index towards at least the 4,480 area. There is an open gap at 4,580. I do not expect to see the gap filled if price is in the process of a corrective phase now. Second downside target is at 4,400.
 English
 Русский
 Bahasa Indonesia
 Bahasa Malay
 ไทย
ไทย Español
 Deutsch
 Български
 Français
 Tiếng Việt
 中文
中文 বাংলা
বাংলা हिन्दी
 Čeština
 Українська
 Română

