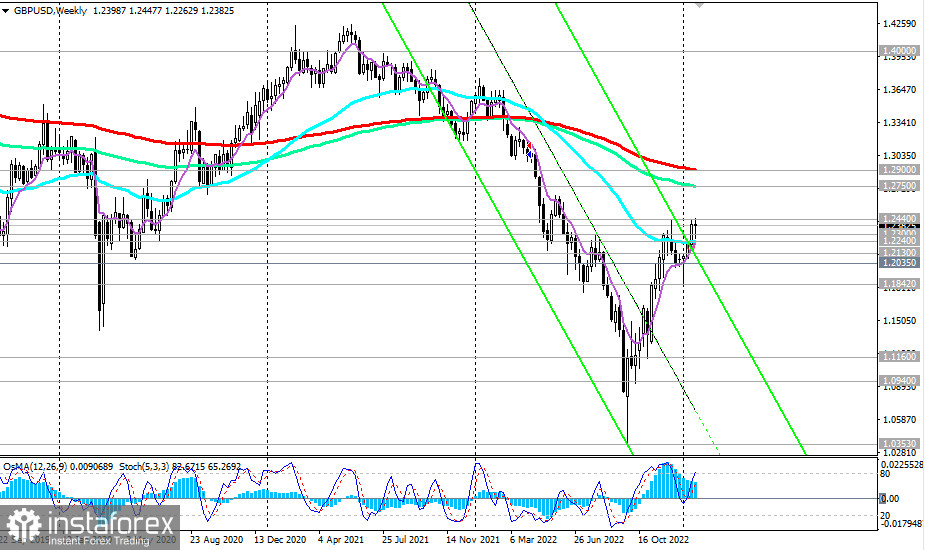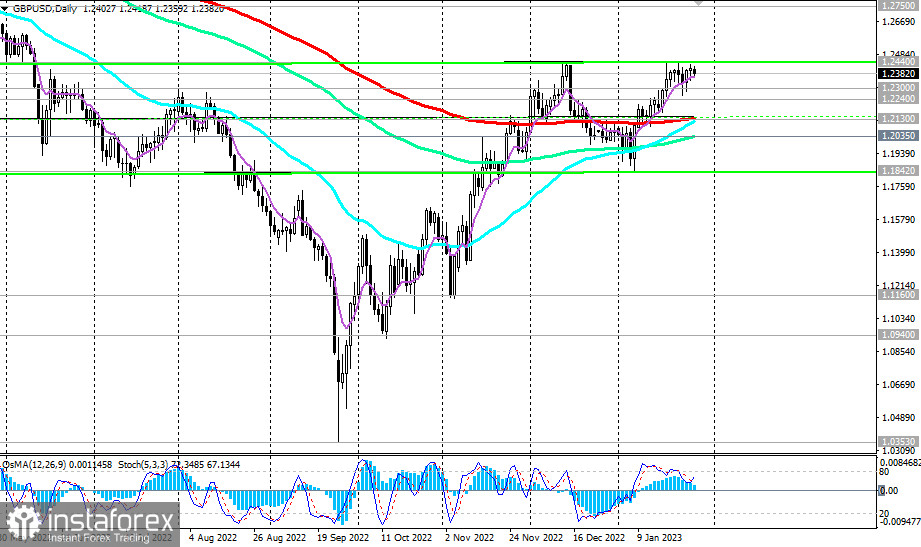
GBP/USD managed to correct into the medium-term bull market zone amid a weak U.S. dollar, rising above 1.2130, 1.2240, through which important support levels pass: 200 EMA on the daily chart and 200 EMA on the weekly chart.
Despite the pair's growth, there is still a long term global downward trend below the key resistance levels 1.2750 (144 EMA on the weekly chart) and 1.2900 (200 EMA on the weekly chart), which makes short positions preferrable.

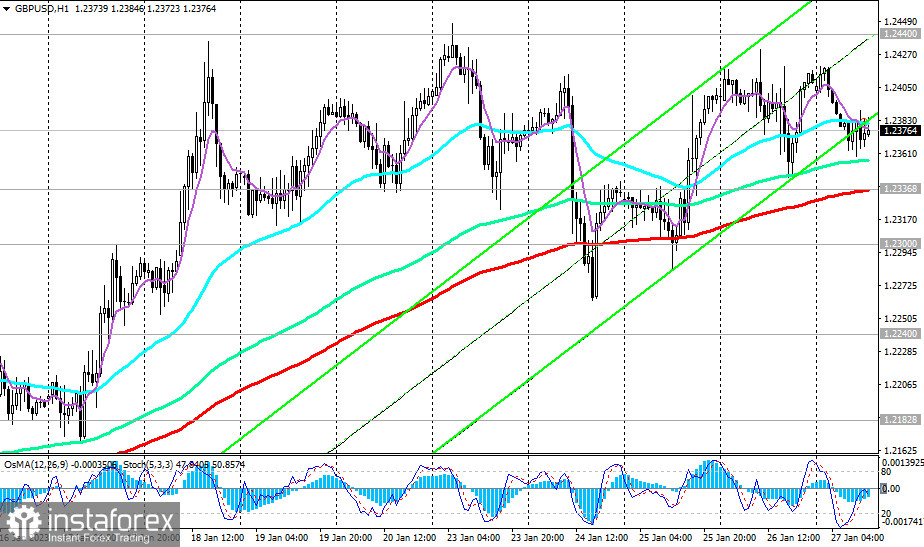
A consecutive breakdown of the support levels 1.2130, 1.2035 (144 EMA on the daily chart and the upper limit of the downward channel on the weekly chart) will return GBP/USD to the long-term bear market zone, sending it towards the September lows near the 1.0400 mark. The first signal to build up short positions may be a breakdown of the important short-term support level 1.2337 (200 EMA on the 1-hour chart).

Alternatively, GBP/USD will continue to rise towards the key resistance levels 1.2750, 1.2900. The signal for the resumption of long positions will be the breakdown of today's high at 1.2418 and the local resistance level (this month's high) at 1.2447.
Support levels: 1.2337, 1.2300, 1.2240, 1.2183, 1.2130, 1.2100, 1.2035, 1.2000, 1.1842, 1.1160, 1.0940
Resistance levels: 1.2400, 1.2447, 1.2500, 1.2600, 1.2750, 1.2800, 1.2900
Trading scenarios
Sell Stop 1.2330. Stop-Loss 1.2420. Take-Profit 1.2300, 1.2240, 1.2183, 1.2130, 1.2100, 1.2035, 1.2000, 1.1842, 1.1160, 1.0940
Buy Stop 1.2420.Stop-Loss 1.2330. Take-Profit 1.2440, 1.2500, 1.2750, 1.2800, 1.2900
 English
 Русский
 Bahasa Indonesia
 Bahasa Malay
 ไทย
ไทย Español
 Deutsch
 Български
 Français
 Tiếng Việt
 中文
中文 বাংলা
বাংলা हिन्दी
 Čeština
 Українська
 Română

