Technical Market Outlook:
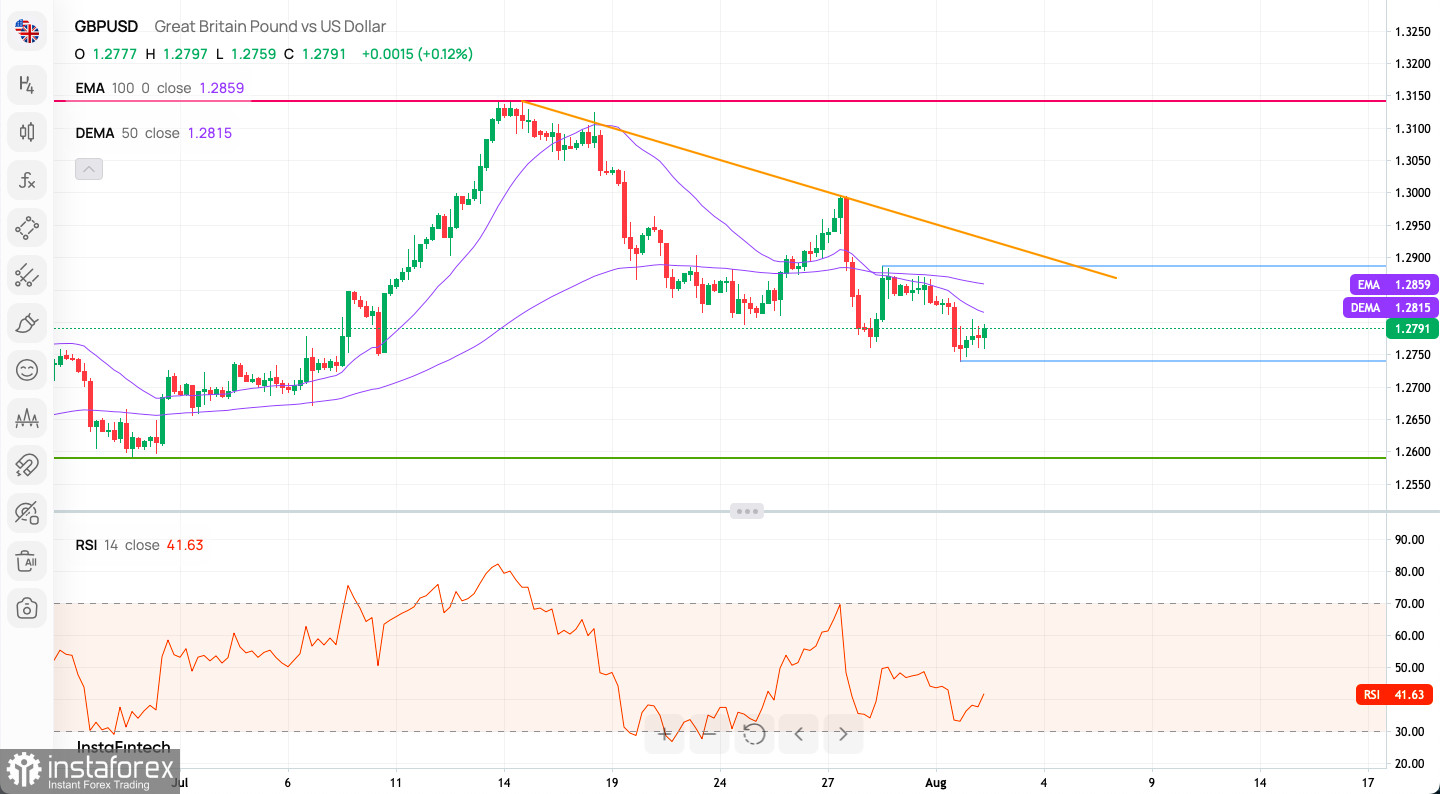
The GBP/USD pair has reversed sharply from the local high made at the level of 1.2994 as the bears managed to break below the 50 and 100 MA on the H4 time frame chart. In the result, the bears made a new local low at the level of 1.2737 as the bearish pressure continues. The intraday technical support is seen at the level of 1.2762 and the intraday technical resistance is located at 1.2994. The market still trades inbetween those level, in the middle of the trading zone, but is below the 50 and 100 MA already. The next target for bears is seen at the level of 1.2762. The weak and negative momentum on the H4 time frame chart supports the short-term bearish outlook for GBP.

Weekly Pivot Points:
WR3 - 1.28955
WR2 - 1.28754
WR1 - 1.28671
Weekly Pivot - 1.28553
WS1 - 1.28470
WS2 - 1.28352
WS3 - 1.28151
Trading Outlook:
The bulls keep continuing the up trend towards the key technical resistance located at the level of 1.3163 and a breakout above this level is needed to extend the up trend towards the last Weekly swing high seen at 1.4248. Only a sustained breakout blow the technical support seen at the level of 1.1775 would change the outlook to bearish.
 English
 Русский
 Bahasa Indonesia
 Bahasa Malay
 ไทย
ไทย Español
 Deutsch
 Български
 Français
 Tiếng Việt
 中文
中文 বাংলা
বাংলা हिन्दी
 Čeština
 Українська
 Română

