 English
  Русский
 Bahasa Indonesia
 Bahasa Malay
 ไทย
ไทย Español
 Deutsch
 Български
 Français
 Tiếng Việt
 中文
中文 বাংলা
বাংলা हिन्दी
 Čeština
 Українська
 Română

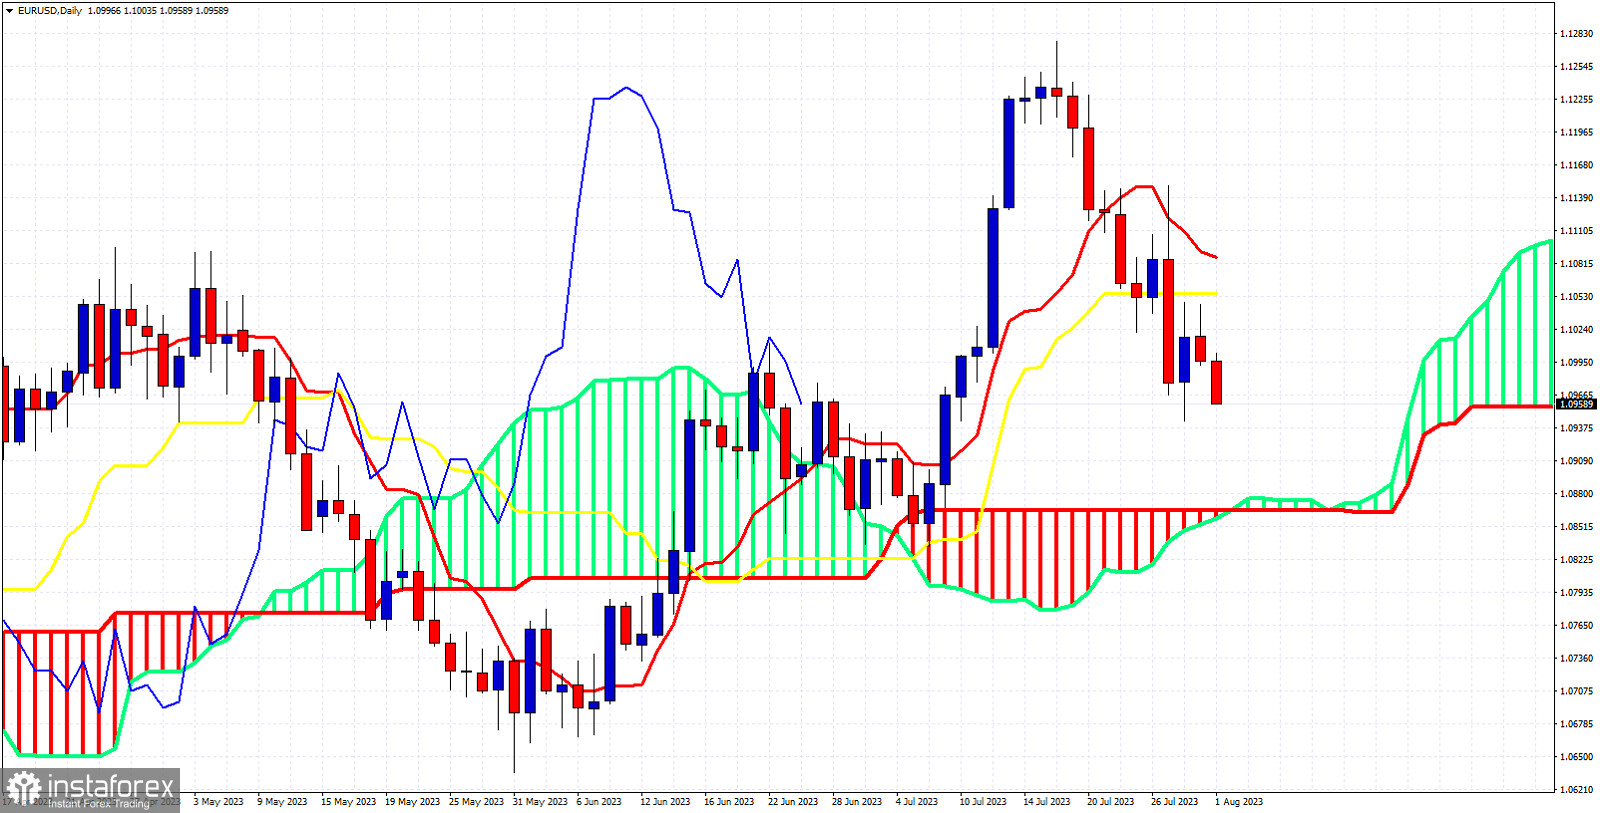
EURUSD is trading around 1.0957. In Ichimoku cloud terms we have a mixed picture. The Daily chart remains bullish as price is still above the Kumo (cloud). Despite being bullish, we have some warning signs for traders. Price has broken below the tenkan-sen (Red line indicator) and the kijun-sen (yellow line indicator). This break down is a sign of weakness. EURUSD is vulnerable to a move towards the cloud at 1.0866. In the near term, the Ichimoku cloud indicator is in a bearish trend. The Chikou span (black line indicator) remains above the candlestick pattern (bullish) but is challenging key support now at 1.09. A deep pull back is under way. A break below 1.09 suggests that more weakness should be expected.