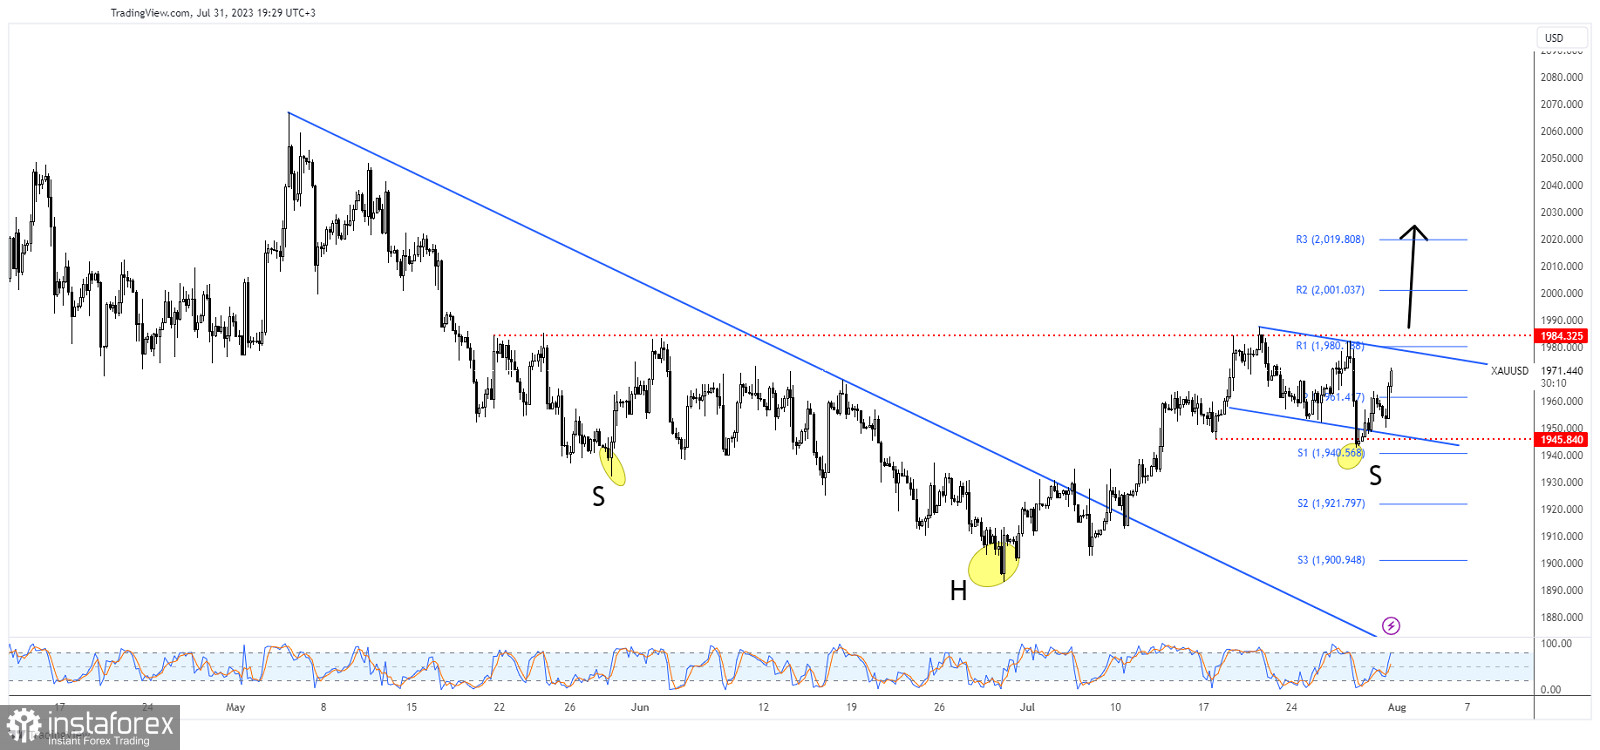
The price of gold rallied in the short term and it seems strongly bullish. It's located at 1,971 at the time of writing and it looks to trade higher as the Dollar Index retreated a little. Technically, Gold developed a bullish pattern which needs confirmation.
XAU/USD edged higher but it remains to see how it reacts in the morning when the RBA is expected to increase the Cash Rate from 4.10% to 4.35%. Also, the US Manufacturing PMI could jump to 46.9 points from 46.0 points, while JOLTS Job Openings may drop to 9.61M from 9.82M. Better than expected US data during the week could punish the price of gold.
XAU/USD Flag Formation!

As you can see on the H4 chart, XAU/USD passed above the downtrend line announcing a new leg higher. The price action developed a potential H&S pattern, the 1,982 could be seen as the neckline.
The rate found support on the 1,945 immediate low and now it has jumped higher. The rate developed a potential flag pattern.
XAU/USD Forecast!
Jumping and consolidating above 1,984 may announce further growth and is seen as a buying opportunity as the rate should extend its rally.
 English
 Русский
 Bahasa Indonesia
 Bahasa Malay
 ไทย
ไทย Español
 Deutsch
 Български
 Français
 Tiếng Việt
 中文
中文 বাংলা
বাংলা हिन्दी
 Čeština
 Українська
 Română

