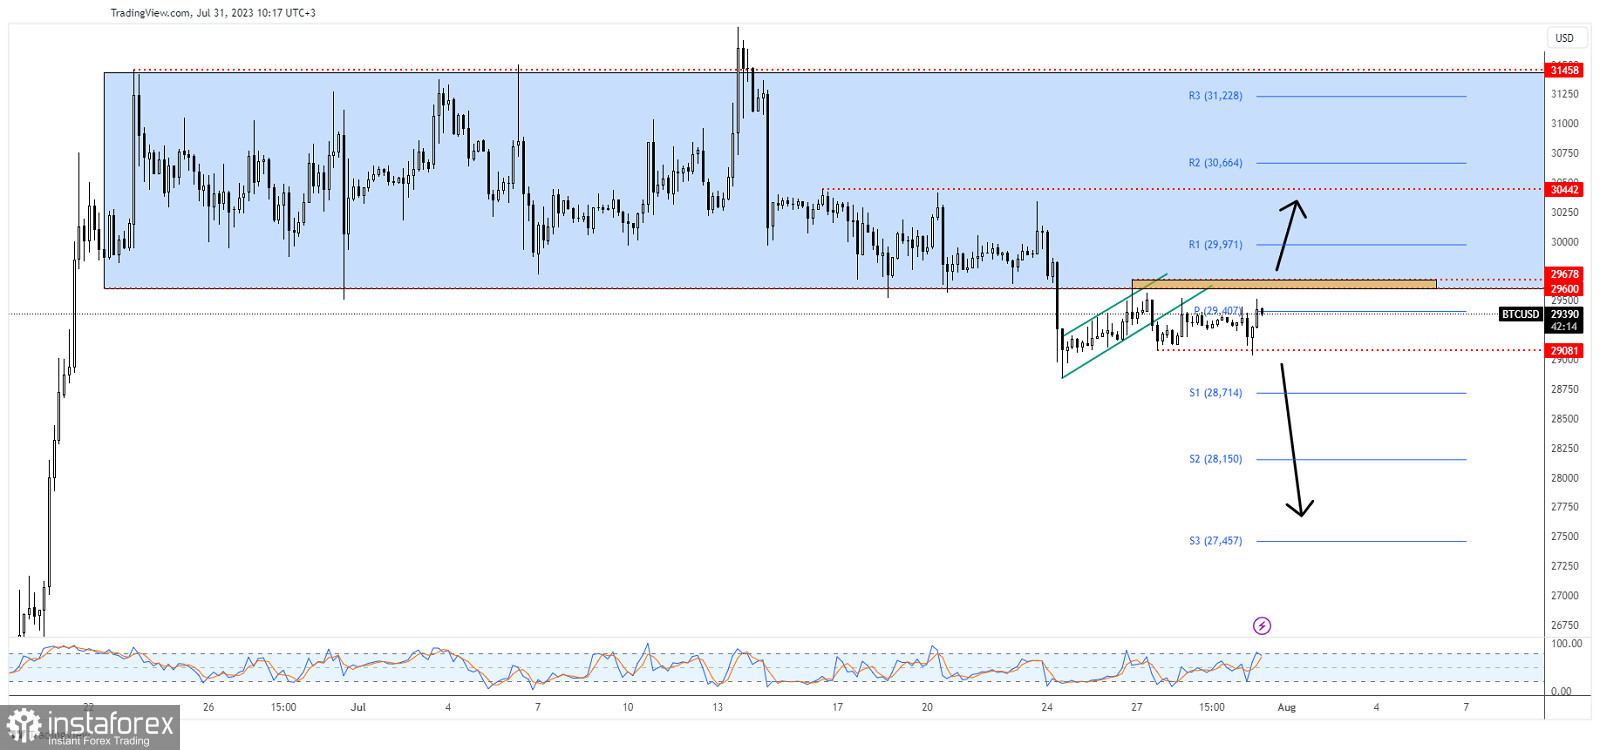
The price of Bitcoin is moving sideways in the short term and it seems undecided. Technically, after its massive drop, a rebound is natural. It's trading at 29,409 at the time of writing and it seems determined to come back higher. Still, a new leg higher needs strong confirmation.
In the last 24 hours, Bitcoin is up by 0.45% but it's down by 1.27% in the last 7 days. Technically, the downside pressure remains high after taking out the near-term support levels.
BTC/USD Trapped Between 29,081 And 29,678!

As you can see on the H4 chart, the price escaped from the minor flag pattern but it has failed to resume the leg down. The 29,081 low represents a key static support, while the former high of 29,678 stands as a static resistance.
Only escaping from this minor range pattern could bring new opportunities. You knew from my previous analysis that breaking below 29,600 announced more declines.
BTC/USD Prediction!
A bearish closure below 29,081 activates more declines. On the contrary, jumping and closing above 29,678 may announce a larger rebound.
 English
 Русский
 Bahasa Indonesia
 Bahasa Malay
 ไทย
ไทย Español
 Deutsch
 Български
 Français
 Tiếng Việt
 中文
中文 বাংলা
বাংলা हिन्दी
 Čeština
 Українська
 Română

