Technical outlook:
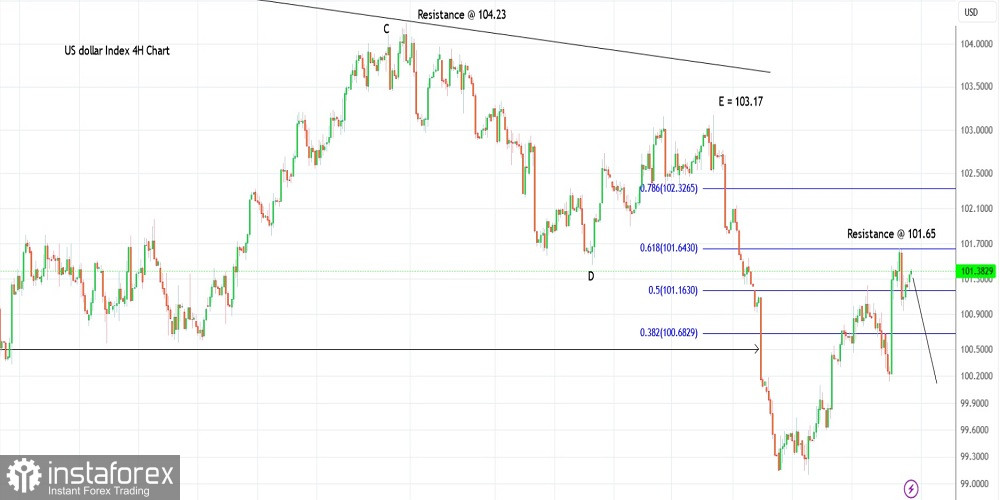
The US dollar index rallied through the 101.65 resistance on Friday and reversed lower thereafter. The index has produced an Engulfing Bearish candlestick pattern on the 4H chart indicating a potential reversal ahead. It is seen to be trading close to 101.50 at this point in writing and is projected to turn lower towards 98.00 going further.
The US dollar index had broken out of the triangle consolidation after reversing from 103.17 which was Wave E termination as marked here. The index is now looking poised to carve a meaningful downswing, which could push the instrument down to 98.00 in the coming few weeks. Immediate price resistance is seen at 103.17 and prices should stay lower to keep the bearish structure intact.
The US dollar index has further carved a lower-degree downswing between 103.17 and 99.16. The above downswing has been retraced to the Fibonacci 0.618 level at 101.65 as projected on the chart here. A high probability remains for the bears to come back in control from here and drag the index lower towards 98.00 at least.
Trading idea:
A potential drop towards 98.00 to resume soon.
Good luck!
 English
 Русский
 Bahasa Indonesia
 Bahasa Malay
 ไทย
ไทย Español
 Deutsch
 Български
 Français
 Tiếng Việt
 中文
中文 বাংলা
বাংলা हिन्दी
 Čeština
 Українська
 Română

