You require the following to open long positions on EUR/USD:
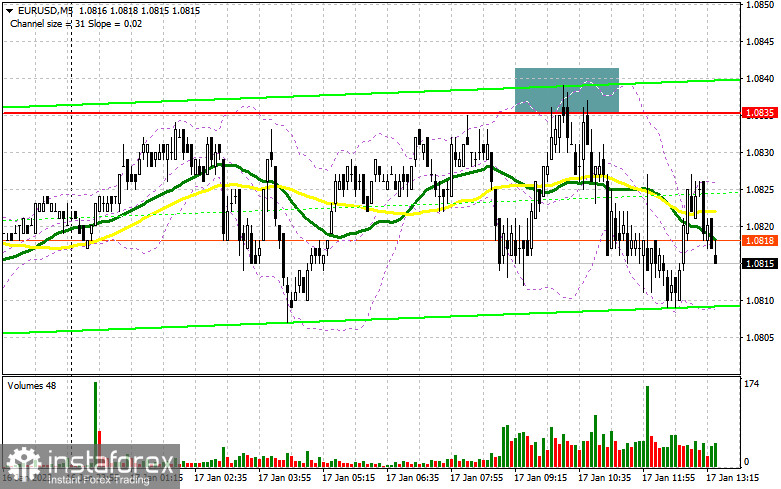
Only one indication to enter the market was produced in the morning. Let's analyze the 5-minute chart to see what transpired there. I focused on the level of 1.0835 in my morning forecast and suggested selling there in the event of a false breakdown. Oddly, the euro showed no response to the relatively excellent basic numbers, suggesting that there may not be any buyers at the current highs and market conditions. A false breakdown at 1.0835 produced a sell signal, but when the trading instrument dropped by 25 points, the pressure on it decreased. The technical situation remained unchanged for the remainder of the day.

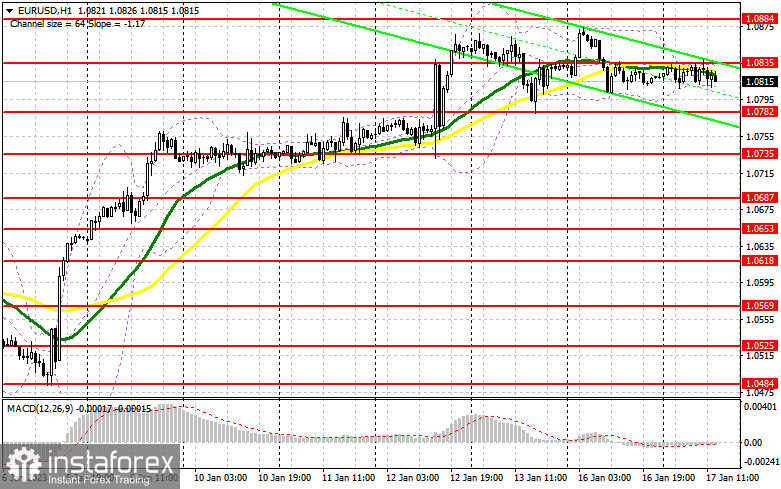
Although US data are not highly correlated with the foreign currency market, let's see how traders respond to them. It is anticipated that a report on the Empire Manufacturing index will come in better than predicted, which might theoretically boost the value of the dollar. John Williams, a Fed representative, will make a much more captivating speech. Furthermore, the article's hawkish tenor will give euro sellers more assurance. The formation of a false breakdown in the area of 1.0782 will give the bulls an entry point to buy and return to the maximum in the area of 1.0835, above which it was not possible to get out in the first half of the day, so in the case of a normal decline in the euro during the first half of the day, it is better to wait. With an increase at 1.0884, the emergence of a new bullish trend will be signaled by a breakout and top-down test of this range, which will create another entry point for building up long holdings. The bears' stop orders will also be hit if this level is broken, creating a second signal and the potential for a breakthrough to 1.0931, where I will fix the profit. The pressure on the pair will rise significantly if EUR/USD declines and there are no buyers at 1.0782 in the afternoon, which is where everything is headed. The next support level around 1.0735 is therefore where attention is focused, and only the occurrence of a false fall will provide a signal to buy the euro. I'll start long positions right now in anticipation of a recovery from the 1.0687 low or even lower, around 1.0653, with the goal of a 30- to 35-point upward reversal during the day.
You must the following to open short trades on EUR/USD:
The bears were able to defend the rather contentious resistance of 1.0835 based on extremely compelling basic data about the eurozone, allowing them to plan for a further decrease in the value of the euro. I'm betting on a decline to the vicinity of 1.0782 while trade is taking place below this level. Waiting for another false breakdown at 1.0835 would be ideal since it would ensure that there are significant sellers in the market. Strong US data and a breakdown and reverse test of 1.0782 will be sufficient to create a short-term downward correction for the pair, generating a second sell signal with an exit to the level of 1.0735. A consolidation below this range will result in a stronger decline to the level of 1.0687, which will bring back the bear market. I'll set the profit there. I will prefer to take short positions only from 1.0884 if the EUR/USD rises during the American session and there are no bears at 1.0835, a possibility that, given the current volatility, cannot be completely ruled out. Additionally, it makes sense to watch for ineffective consolidation and a phony breakdown. On a recovery from the high of 1.0931, I will sell the EUR/USD pair right away with an eye toward a 30- to 35-point fall to the downside.

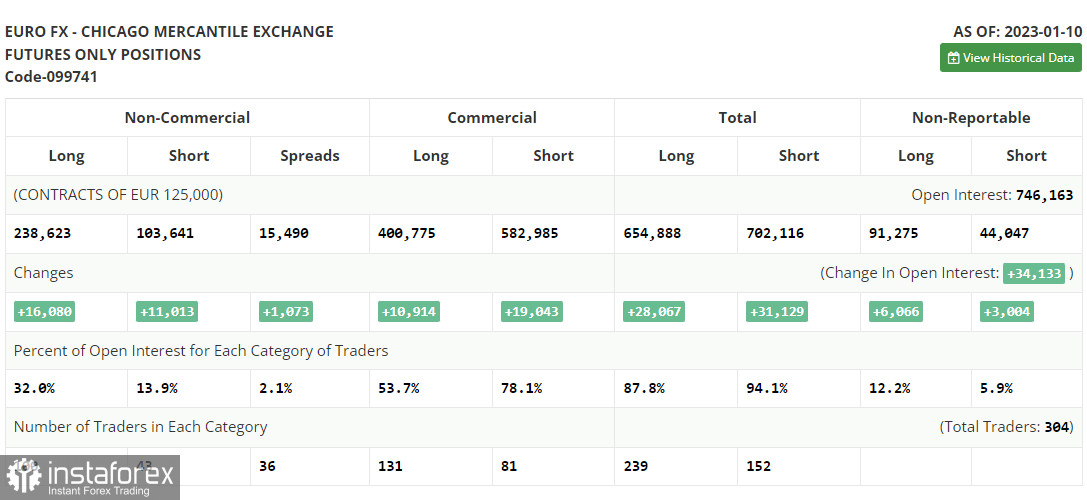
The COT report (Commitment of Traders) for January 10 revealed a substantial increase in both long and short holdings. After the New Year's break and the announcement of inflation numbers showing a slowdown in the rate of price growth in the United States in December of this year, it is clear that traders are returning to the market. Due to this arrangement, the Federal Reserve System can only raise interest rates by 0.25%, which is harmful to the US currency and hurts its position versus the euro. This arrangement allowed the Federal Reserve System to slow down with an increase in interest rates already at its February meeting. The slowdown in aggressive US policies is bringing back a desire for risk, which is increasing demand for hazardous assets and making assets whose prices have plummeted over the past year quite appealing. It is now vital to keep an eye on the remarks made by Federal Reserve System officials and make some inferences about the likely direction the committee will take in February of this year. According to the COT data, the number of long non-commercial posts climbed by 16,080, to 238,623, while the number of short non-commercial positions increased by 11,013, to 103,641. The total non-commercial net position rose to 134,982 from 129,915 towards the conclusion of the week. All of this shows that investors are still buying euros with the assumption that this year's harsh central bank measures will ease; nonetheless, a new fundamental justification is required for the euro to continue to expand positively. The weekly ending price increased from 1.0617 to 1.0787.

Signals from indicators
Moving Averages
The fact that trading occurs around the 30 and 50-day moving averages suggests that the market is lateral.
Note that the author's consideration of the period and costs of moving averages on the hourly chart H1 differs from the standard definition of the traditional daily moving averages on the daily chart D1.
Bands by Bollinger
The indicator's upper limit, which is located at 1.0835, will serve as resistance in the event of growth.
Description of indicators
- Moving average (moving average determines the current trend by smoothing out volatility and noise). Period 50. The graph is marked in yellow.
- Moving average (moving average determines the current trend by smoothing out volatility and noise). Period 30. The graph is marked in green.
- MACD indicator (Moving Average Convergence / Divergence - moving average convergence/divergence) Fast EMA period 12. Slow EMA period 26. SMA period 9
- Bollinger Bands (Bollinger Bands). Period 20
- Non-profit speculative traders, such as individual traders, hedge funds, and large institutions, use the futures market for speculative purposes and to meet certain requirements.
- Long non-commercial positions represent the total long open position of non-commercial traders.
- Short non-commercial positions represent the total short open position of non-commercial traders.
- Total non-commercial net position is the difference between the short and long positions of non-commercial traders.
 English
 Русский
 Bahasa Indonesia
 Bahasa Malay
 ไทย
ไทย Español
 Deutsch
 Български
 Français
 Tiếng Việt
 中文
中文 বাংলা
বাংলা हिन्दी
 Čeština
 Українська
 Română

