 English
  Русский
 Bahasa Indonesia
 Bahasa Malay
 ไทย
ไทย Español
 Deutsch
 Български
 Français
 Tiếng Việt
 中文
中文 বাংলা
বাংলা हिन्दी
 Čeština
 Українська
 Română

EUR/USD
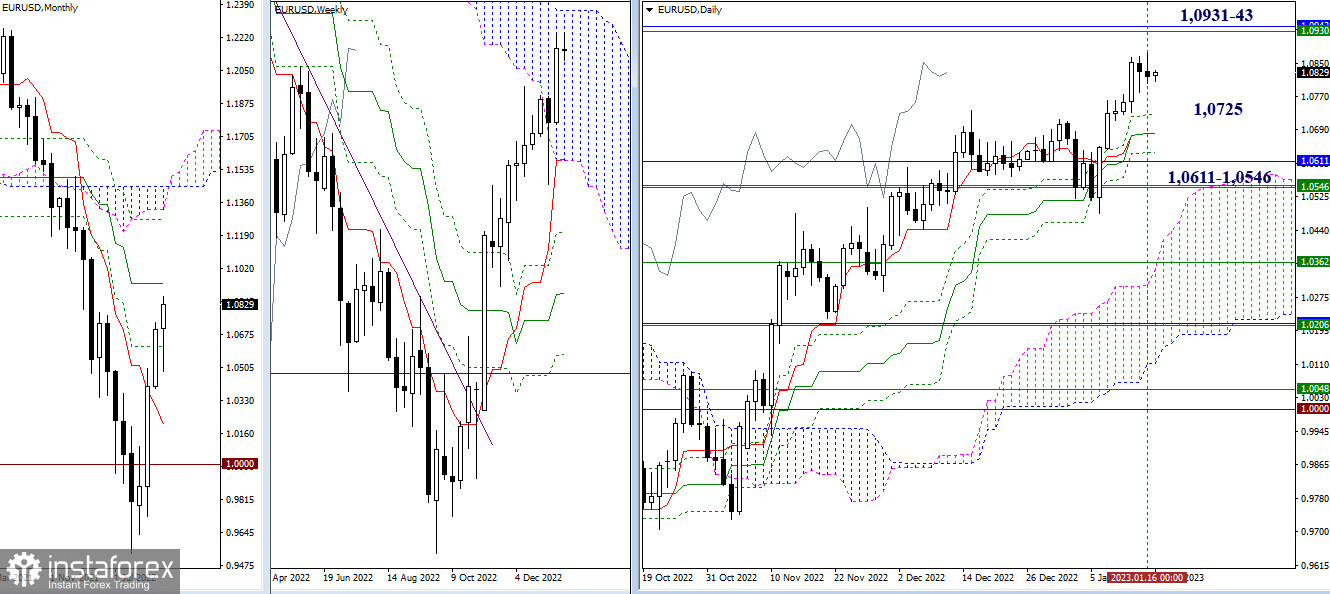
Higher time frames
EUR/USD was trading sideways yesterday, with no clear direction within the day. So, the previous forecast remains relevant. The key upward target for bulls is the area of 1.0931-43 (upper target of the weekly Ichimoku Cloud + monthly medium-term trend). In case bears are active, their targets will be found at the support area of the daily Ichimoku Cross (1.0725 – 1.0679 – 1.0633) and the accumulation of monthly and weekly levels of 1.0611 – 1.0546 located slightly lower.
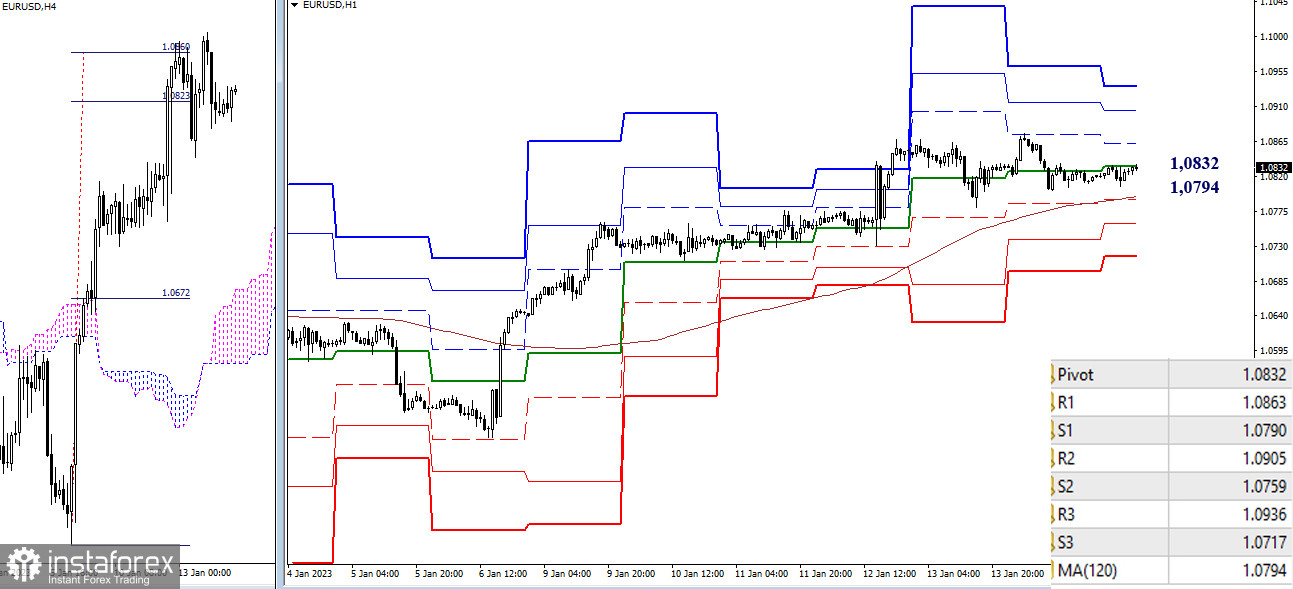
H4 – H1
On lower time frames, the situation is uncertain. The pair is hovering near the resistance area formed by the central pivot level of 1.0832). Trading above the weekly long-term trend of 1.0794 will maintain the bullish trend. Intraday upward targets are found at the standard pivot levels of 1.0863 – 1.0905 – 1.0936. Consolidation below the weekly long-term trend (1.0794) will change the market balance on lower time frames. In this case, bears will head for the area of 1.0759 – 1.0717.
***
GBP/USD
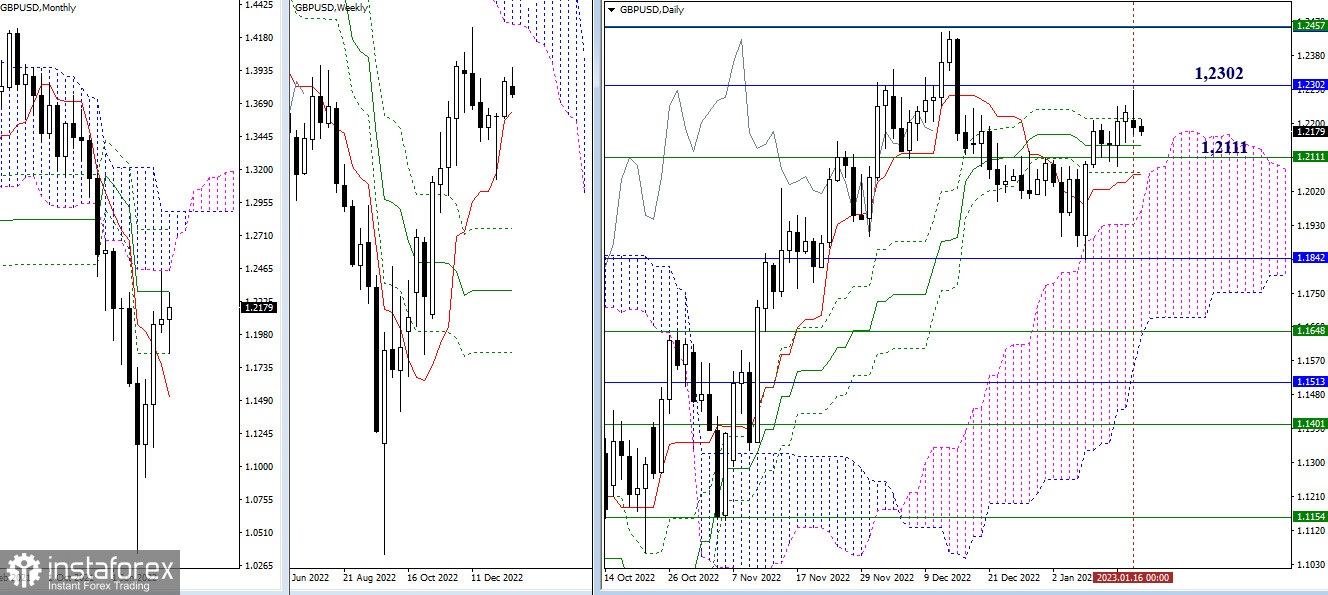
Higher time frames
After testing the resistance zone and the monthly level of 1.2302, the pair pulled back on the daily chart to the consolidation zone. The main upward target for bulls remains the level of 1.2302. Meanwhile, bears will need to settle inside the daily Ichimoku Cloud and focus on the accumulation of support levels of the daily Ichimoku Cross (1.2214 – 1.2142 – 1.2064) supported by the weekly short-term trend at 1.2111.
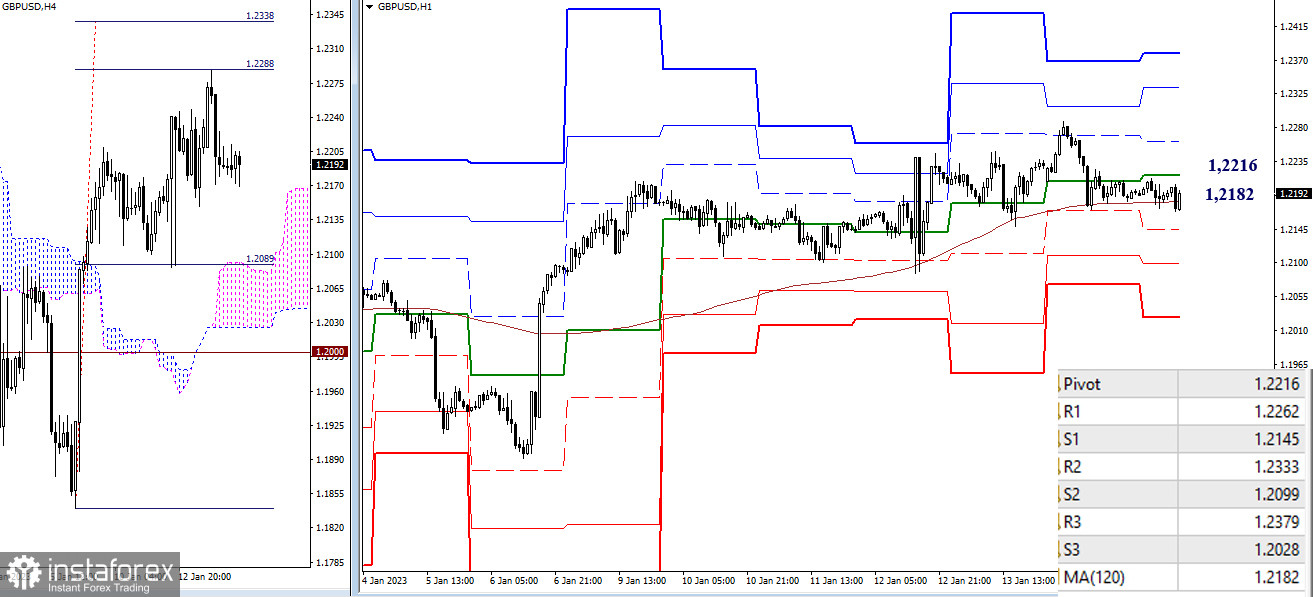
H4 – H1
On lower time frames, the pair is trading sideways between the key levels of 1.2216 (central pivot level) and 1.2182 (weekly long-term trend). If bulls take over and the price breaks above the current channel, the resistance of standard pivot levels (1.2262 – 1.2333 – 1.2379) will become relevant again. If the price moves below the channel under bearish pressure, the sellers may change the market balance and send the pair lower to the support in the form of standard pivot levels of 1.2145 – 1.2099 – 1.2028).
***
Technical analysis is based on:
Higher time frames – Ichimoku Kinko Hyo (9.26.52) + Fibo Kijun levels
H1 – Pivot Points (standard) + 120-day Moving Average (weekly long-term trend)