 English
  Русский
 Bahasa Indonesia
 Bahasa Malay
 ไทย
ไทย Español
 Deutsch
 Български
 Français
 Tiếng Việt
 中文
中文 বাংলা
বাংলা हिन्दी
 Čeština
 Українська
 Română

You require the following to open long positions on the GBP/USD:
The Bank of England Governor, Andrew Bailey, will give a speech in the afternoon, which might cause a spike in volatility and add to the pressure on the pound that was already there throughout the European session. Another movement of the pound down to the region of the closest support of 1.2152 will result from Bailey's subdued tone. To return to 1.2220, a new resistance created by today's results, the development of a false breakdown at this level will trigger a buy signal and continue the upward trend. The potential for growth at 1.2283 (where I will take profit) will be presented by a breakout of 1.2220 with a top-down test. Even though the level of 1.2350 will be further away, we won't be able to quickly attain it without significant political or structural reforms. If the bulls are unable to handle the challenges and miss 1.2152, I anticipate the emergence of a stronger negative downturn. Because of this, I caution you against making hasty purchases and suggest that you instead begin long positions on a fall and a fake breakdown close to the subsequent low of 1.2093. To recover from 1.2008 and correct 30-35 points within a day, I will buy GBP/USD right away.
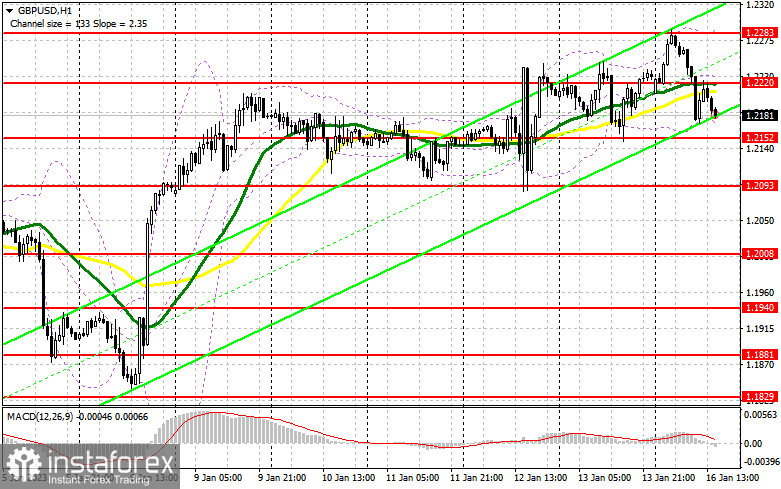
You require the following to open short trades on the GBP/USD:
The market will be under the control of bears when trade is done below 1.2220. It is clear that 1.2220, where the bears first appeared in the morning, is a crucial resistance that the sellers will vigorously defend. This makes the creation of a false breakdown in the area of 1.2220 the ideal scenario for sales, but it should be noted that if there isn't an active downward movement from this area, buyers will come back to the market. The support level of 1.2152 will be the bears' intended objective given the current circumstances. The pressure on the pound will only rise with a breakout and a reversal test from the bottom up of this range, which will also provide an entry point to sell with a move to 1.2093 and the potential for updating 1.2008, where I advise fixing profits. The region around 1.1940 will be the farthest objective. Buyers of the pound will feel its strength due to the possibility of GBP/USD growth and the lack of bears around 1.2220 in the afternoon, which might result in an update of the monthly maximum. In this instance, the only entry opportunity into short positions with the intention of a new downward movement is a false breakout in the vicinity of the next resistance level of 1.2283. In the lack of activity there, I will sell the GBP/USD pair right away at the highest price of 1.2350, but only if I anticipate a 30- to 35-point decline in the pair's value over the day.
Long and short holdings increased in the COT report (Commitment of Traders) for January 3. The latter turned out to be nearly four times higher, which amply demonstrates the lack of confidence among buyers in the sterling's promising future at the start of this year. This is bad news for the British pound since regulators won't change their approach just yet and will keep raising interest rates. The Bank of England will decrease interest rates and the economy has already entered a recession, which is the key factor limiting the rise of the pound. You can easily ignore the growth of the pound in the first quarter of this year if the figures on inflation in the United States, which are anticipated in the near future, even signal its growth. According to the most recent COT report, short non-commercial positions increased by 12,454 to reach 63,926, while long non-commercial positions increased by 3,040 to reach 43,625. These changes caused the non-commercial net position's negative value to decrease to -20,301 from -5,603 the previous week. The delta's reversal to the downside demonstrates once more that no one is eager to purchase the pound at its current highs. The closing price for the week dropped from 1.2177 to 1.2004.
Signals from indicators
Moving Averages
The fact that trading occurs around the 30 and 50-day moving averages suggests that the market is lateral.
Note that the author's consideration of the period and costs of moving averages on the hourly chart H1 differs from the standard definition of the traditional daily moving averages on the daily chart D1.
Bands by Bollinger
The indicator's upper limit, which is located at 1.2280, will serve as resistance in the event of expansion. The indicator's lower limit, which is located at 1.2180, will serve as support in the event of a downturn.
Description of indicators
- Moving average (moving average determines the current trend by smoothing out volatility and noise). Period 50. The graph is marked in yellow.
- Moving average (moving average determines the current trend by smoothing out volatility and noise). Period 30. The graph is marked in green.
- MACD indicator (Moving Average Convergence / Divergence - moving average convergence/divergence) Fast EMA period 12. Slow EMA period 26. SMA period 9
- Bollinger Bands (Bollinger Bands). Period 20
- Non-profit speculative traders, such as individual traders, hedge funds, and large institutions, use the futures market for speculative purposes and to meet certain requirements.
- Long non-commercial positions represent the total long open position of non-commercial traders.
- Short non-commercial positions represent the total short open position of non-commercial traders.
- Total non-commercial net position is the difference between the short and long positions of non-commercial traders.