Technical Market Outlook:
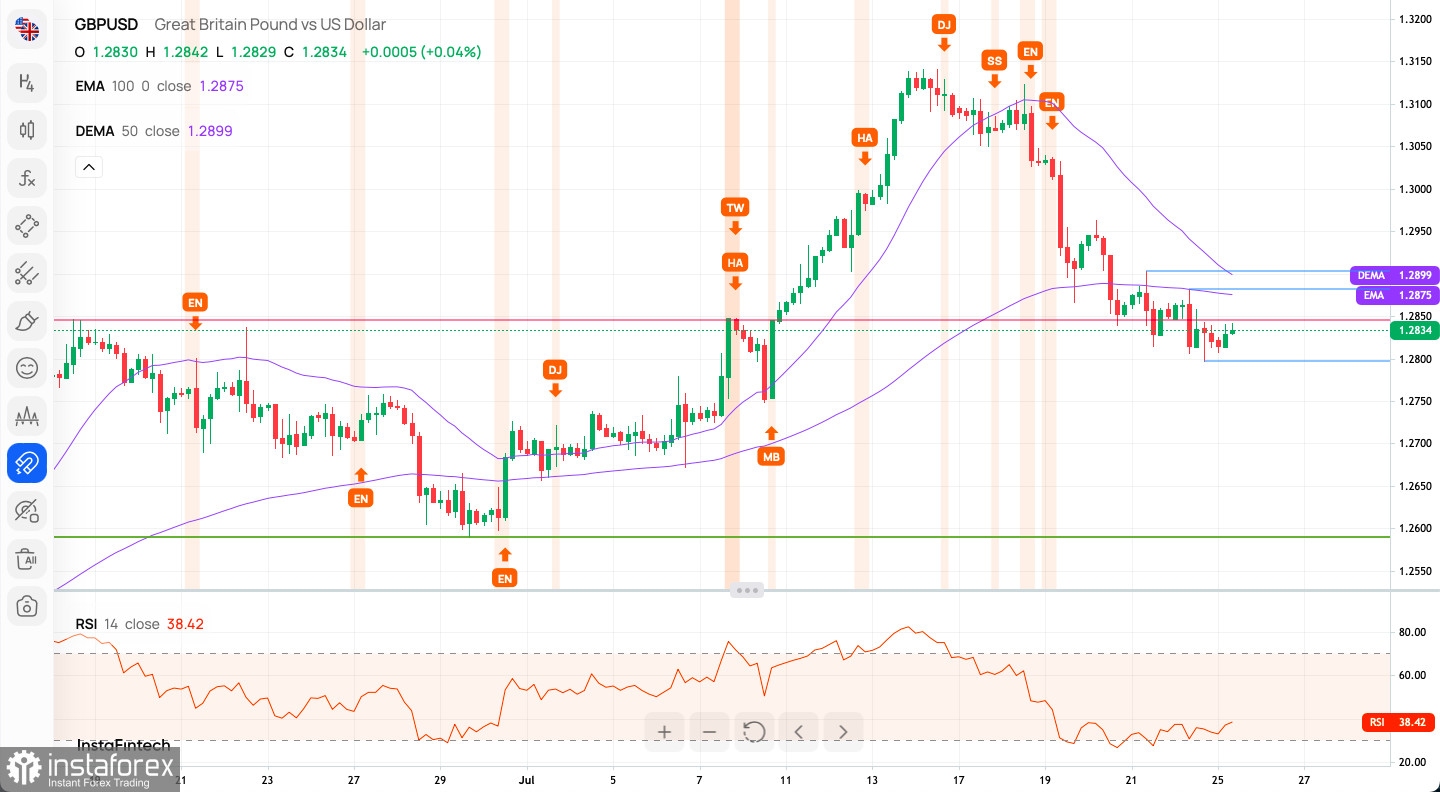
The GBP/USD pair has been seen moving away from the key long term technical resistance on the Weekly time frame chart located at 1.3163. The bears hit the 61% Fibonacci retracement level located at 1.2802 and the market is trying to bounce from this level. The intraday technical resistance is seen at the level of 1.2847 and 1.2881, so this levels need to be violated in order to move up. On the other hand, the market conditions on the H4 time frame chart are extremely oversold already so an intraday technical pull-back might occur with a potential target seen at the level of 1.2881 or higher.

Weekly Pivot Points:
WR3 - 1.29941
WR2 - 1.29173
WR1 - 1.28745
Weekly Pivot - 1.28405
WS1 - 1.27977
WS2 - 1.27637
WS3 - 1.26869
Trading Outlook:
The bulls keep continuing the up trend towards the key technical resistance located at the level of 1.3163 and a breakout above this level is needed to extend the up trend towards the last Weekly swing high seen at 1.4248. Only a sustained breakout blow the technical support seen at the level of 1.1775 would change the outlook to bearish.
 English
 Русский
 Bahasa Indonesia
 Bahasa Malay
 ไทย
ไทย Español
 Deutsch
 Български
 Français
 Tiếng Việt
 中文
中文 বাংলা
বাংলা हिन्दी
 Čeština
 Українська
 Română

