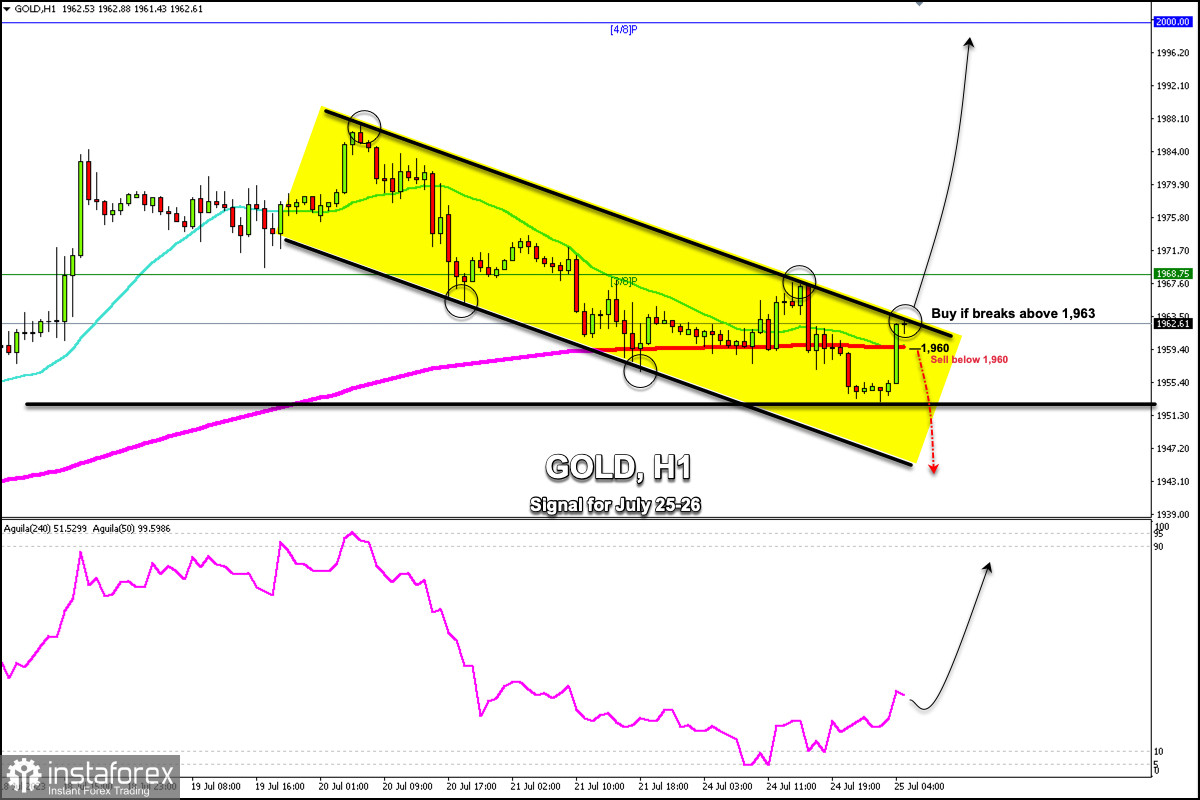
Early in the European session, gold (XAU/USD) is trading at 1,962.61. It is located above the 21 SMA and above the 200 EMA.
The 1-hour chart shows that gold is trading within a downtrend channel formed since July 20 when it reached the high of 1,987.
With a sharp break of this downtrend channel and a daily close above 1,963, we can expect the price to rally and reach 3/8 Murray, so its first target is seen at about 1,968. If bullish force prevails, the metal could reach 1,985 and ultimately the psychological level of $2,000.
On the other hand, in case XAU/USD falls below 1,960, we could expect a downward acceleration and the instrument could reach 1,953 and finally, it could fall to 1,943, a level that coincides with the 200 EMA on the 4-hour chart.
Investors are waiting for the FED to increase its interest rate by 0.25% to 5.50%. The policy announcement could generate strong volatility in gold. If the data is favorable, gold could fall until it reaches 1,937 and 1,906.
On July 24, the Eagle indicator reached a 5-point low, which represents an oversold zone. Since then, we can observe a technical rebound in gold from the 1,953 low. In the next few hours, we expect gold to break sharply the downtrend channel and reach 1,968 and 1,985.
 English
 Русский
 Bahasa Indonesia
 Bahasa Malay
 ไทย
ไทย Español
 Deutsch
 Български
 Français
 Tiếng Việt
 中文
中文 বাংলা
বাংলা हिन्दी
 Čeština
 Українська
 Română

