EUR/USD

Larger timeframe
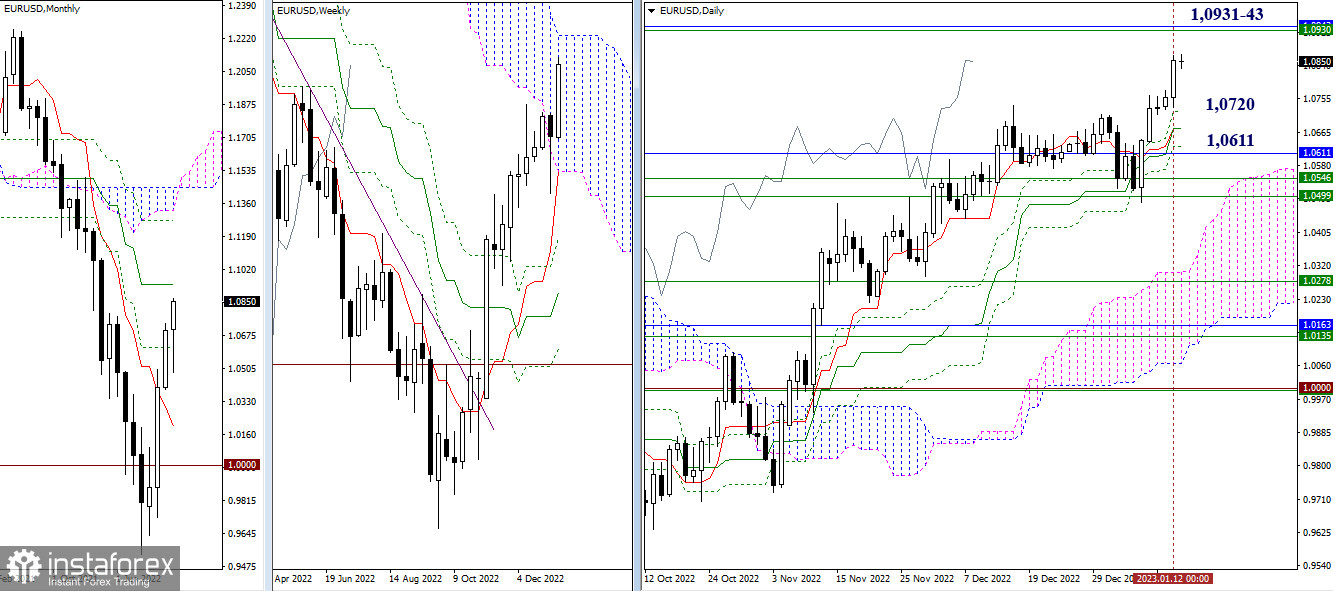
The euro bulls are pushing the instrument up. They coped well yesterday. Now the target level is seen at 1.0931-43, the area of convergence of the resistance of the weekly cloud's upper border and a one-month medium-term trend. The result of this convergence will be the key to a further trajectory. A break higher will determine new targets and open long-term prospects. On the contrary, a rejection will revive the bearish sentiment again and the bears will focus on support. For the time being, the levels of the Ishimoku daily cross, namely 1.0720 – 1.0675 – 1.0630, make up the support area.

H4 – H1
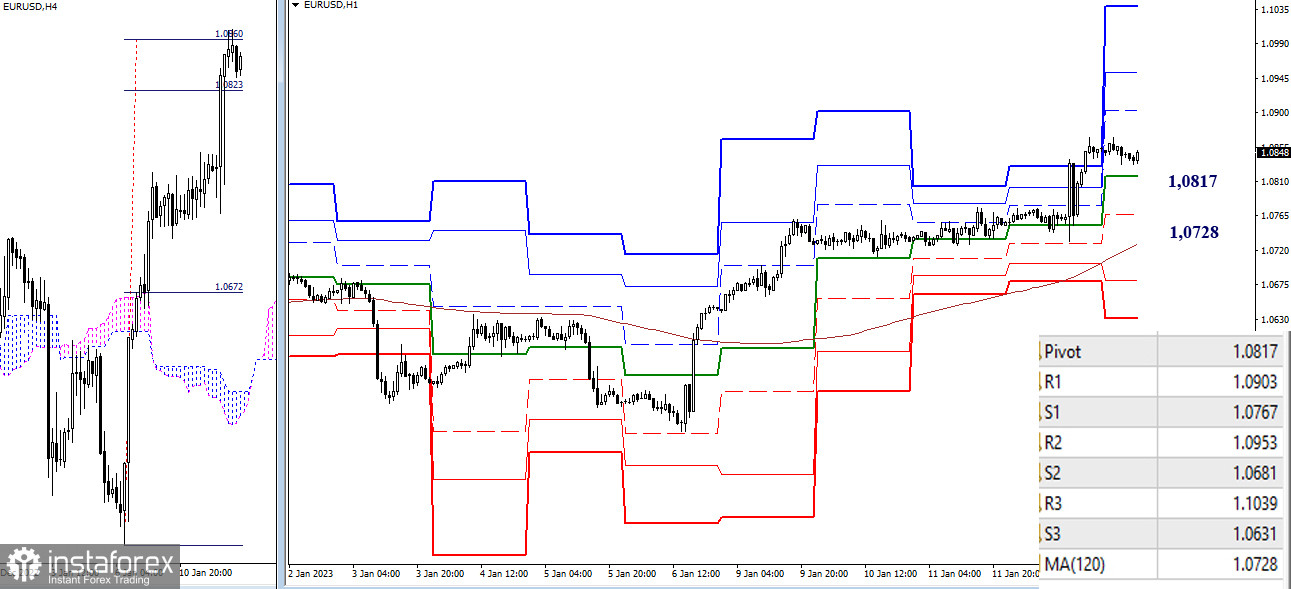
On the 4-hour chart, the target of 0.0860 was hit which coincided with a breakout of the cloud. This put a drag on the price and caused a minor retreat. The downward targets today are the levels which form the support area. These are 1.0817 (the central pivot level) and 1.0728 (a weekly long-term trend). The interim support could be at 1.0767. If the price settles below, this will open the door towards the down move and revise the current balance of trading forces in favor of bearish sentiment. Alternatively, if the euro bulls are able to hold the upper hand and overcome resistance during a breakout of the H4 cloud (1.0860), they will have to deal with intraday targets coinciding with classic pivot levels 1.0903 – 1.0953 – 1.1039.
***
GBP/USD

Larger timeframes
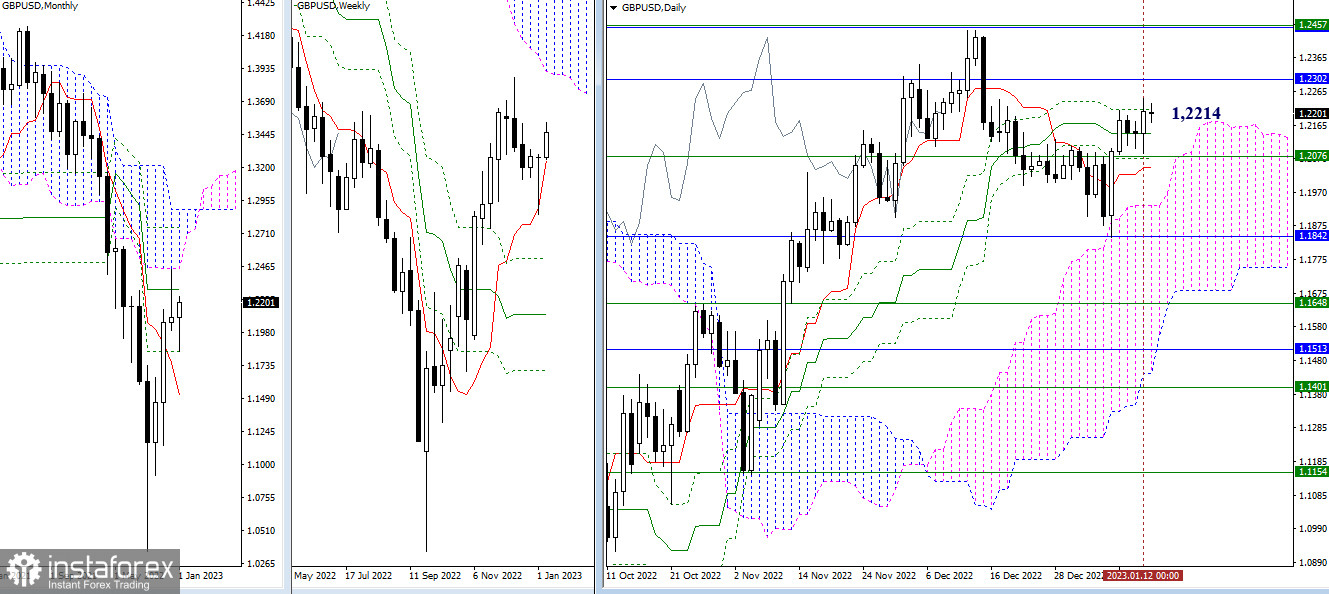
To enable further developments, the major task at this stage is still the same: to destroy the daily dead cross whose upper level is at 1.2214. A further task for the bulls is to test 1.2302, a one-month medium-term trend, and 1.2454-57, the lower borders of the weekly and monthly clouds. The next task for the bulls is to test such crucial levels as 1.2302 (the one-month medium-term trend) and 1.2454-57 (the lower border of the weekly and monthly clouds). At present, the balance of trading forces could be changed and a further trajectory could be revised if the bulls fail to destroy the daily cross and its levels 1.2142 – 1.2071 – 1.2043 will be taken over by the bears.

H4 – H1
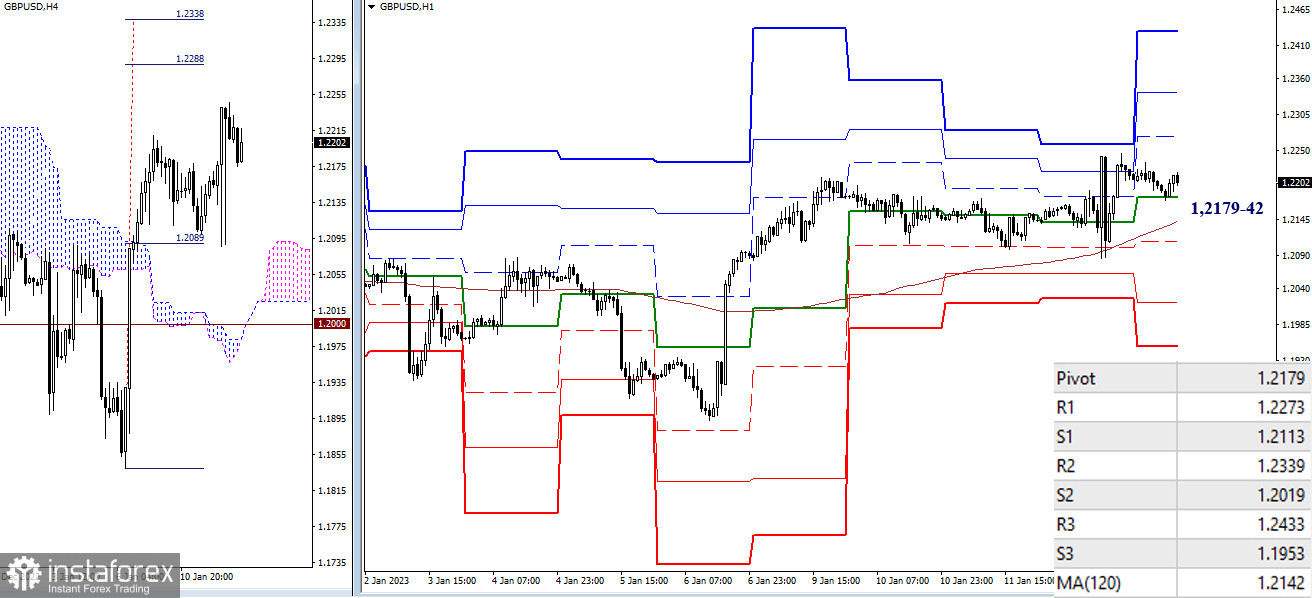
On smaller timeframes, the bulls are still ruling the market. The price is expected to extend its rise intraday and climb through 1.2273 – 1.2339 – 1.2433 which are resistance levels of classical pivot levels. The target is a breakout of the H4 cloud embracing 1.2288 – 1.2338. However, the current balance of trading forces could be changed on the condition of a downward correction. Besides, the key levels on a smaller timeframe which are now seen at 1.2179 (the central pivot level) and 1.2142 (the weekly long-term trend) should be also taken over by the bears. In this case, the bears will shift focus to support levels of classic pivot levels: 1.2113 – 1.2019 – 1.1953.
***
This technical analysis is based on the following ideas:
Larger timeframes - Ichimoku Kinko Hyo (9.26.52) + Fibo Kijun levels
H1 – classic pivot points + 120-period Moving Average (weekly long-term trendline)
 English
 Русский
 Bahasa Indonesia
 Bahasa Malay
 ไทย
ไทย Español
 Deutsch
 Български
 Français
 Tiếng Việt
 中文
中文 বাংলা
বাংলা हिन्दी
 Čeština
 Українська
 Română

